You know your marketing team is busy handling campaigns with tight deadlines. But here’s the question: can you clearly show how that work is translating into impact?
That visibility comes from tracking the right key performance indicators for marketing (KPIs). The ones that connect execution to project management outcomes.
KPIs for marketing project management help you monitor delivery timelines and prove performance across every phase of a campaign. When defined well, KPIs turn simple reporting into real decision-making power.
This article breaks down the KPIs that matter the most for marketing teams. You’ll also learn about key metrics such as team utilization rate, campaign ROI, and CLV, and how to track them for real impact.
What are marketing project management KPIs?
Let’s get precise. KPIs or key performance indicators for marketing are quantifiable metrics tied to specific objectives. In the context of marketing project management, they split into two broad categories:
- Campaign performance metrics: Think conversion rates, or customer lifetime value (CLV) to measure outcomes
- Project delivery metrics: To measure execution, schedule adherence, budget utilization, and team workload
Experienced marketing teams don’t separate performance from delivery. Instead, they connect the two. When a campaign launches late, they see it as a missed revenue window. When costs spike, they know it drags down ROI. The right KPIs for marketing project management help them tie execution directly to outcomes.
Here’s how mature teams build KPI frameworks that go beyond surface-level reporting:
- Every KPI maps back to a specific business goal
- The focus stays on insights that drive action and not just the vanity metrics
- As projects grow more complex, the team evolves how and what they measure
If your marketing KPIs dashboard doesn’t indicate whether your campaigns are on track and creating impact, it’s time to recalibrate.
Why KPIs for marketing project management matter?
You’ve likely seen it. Campaigns with slick creative and the right media mix, yet the results fall flat, or worse, the launch misses its mark. This happens because there are often gaps in execution.
High-performing marketing teams use KPIs to close that gap and guide the entire delivery process.
Here’s how KPIs enable high-performing marketing teams:
Bring clarity across execution layers
KPIs for marketing project management bring clarity to the picture. From the CMO to campaign managers, everyone knows what’s being measured and why. As a result, there’s no confusion about what success looks like.
Early issue detection
When time to launch metrics start slipping, project leads act before delays snowball. This means clients and stakeholders get visibility upfront without chasing for answers.
Helps connect performance with delivery
A strong conversion rate loses its value if the campaign is launched three weeks late. Smart KPI tracking shows not just what worked, but how it was delivered.
Simplifies reporting
For agencies, especially, standardized KPIs for marketing project management make client communication smoother. It means no vague updates and just clear, quantifiable progress tied to business goals.
Ensures continuous improvement
Over time, teams can spot repeat blockers like resource shortages, scope creep, or timing misalignment. As a result, marketers can make quick decisions and adjust their planning based on real data.
Think of KPI dashboards as a powerful project management tool for faster and smarter decisions, ensuring campaign success.
Most common challenges in measuring marketing success
Even experienced teams fall into traps when it comes to ROI measurement in marketing projects. The complex campaign execution makes team lose visibility across systems.
Here are some of the most common challenges marketers face when measuring success.
Disjointed systems and siloed metrics
Too often, creative and project teams work with different tools. As a result, they struggle to connect campaign performance metrics such as ROI and engagement with delivery data (like budget adherence, resource use).
For example, you know the campaign brought in 2,000 leads, do you know whether it launched on time? Or how many unplanned hours your team logged to deliver it?
What happens here is that you track results, but not the cost of getting there.
Over-indexing on performance, under-tracking the process
Marketing teams often obsess over outcomes like cost per leads and revenue attribution. But sometimes they fail to analyze how efficiently they reached those results.
Let’s say your CPL hit $45 instead of the $30 target. But why did this happen? Was the media plan to blame? Or did late approvals and resourcing gaps push the launch off course by 10 days?
Without tracking the delivery process, performance data lacks context.
Vanity metrics disguised as success
Open rates and social media shares offer quick feedback on how your content performs, especially for top-of-funnel campaigns. For many short-term goals, these metrics remain essential.
But in agency settings, it’s important to look beyond the initial response. Without mapping these indicators to downstream results, they risk staying at the surface.
Experienced teams ensure these metrics are part of a broader performance KPIs like qualified leads and conversions. They track them, report them, but always tie them back to the impact they’re designed to influence.
KPI overload with no prioritization
Dashboards cluttered with 30+ metrics dilute attention and overwhelm teams. Without a tight, curated set of KPIs teams can lose focus.
That’s why it’s important to choose a small set of KPIs for marketing project management across execution and impact. Track them in a centralized platform. And most importantly, review them regularly, ideally, in the same place where the work happens.
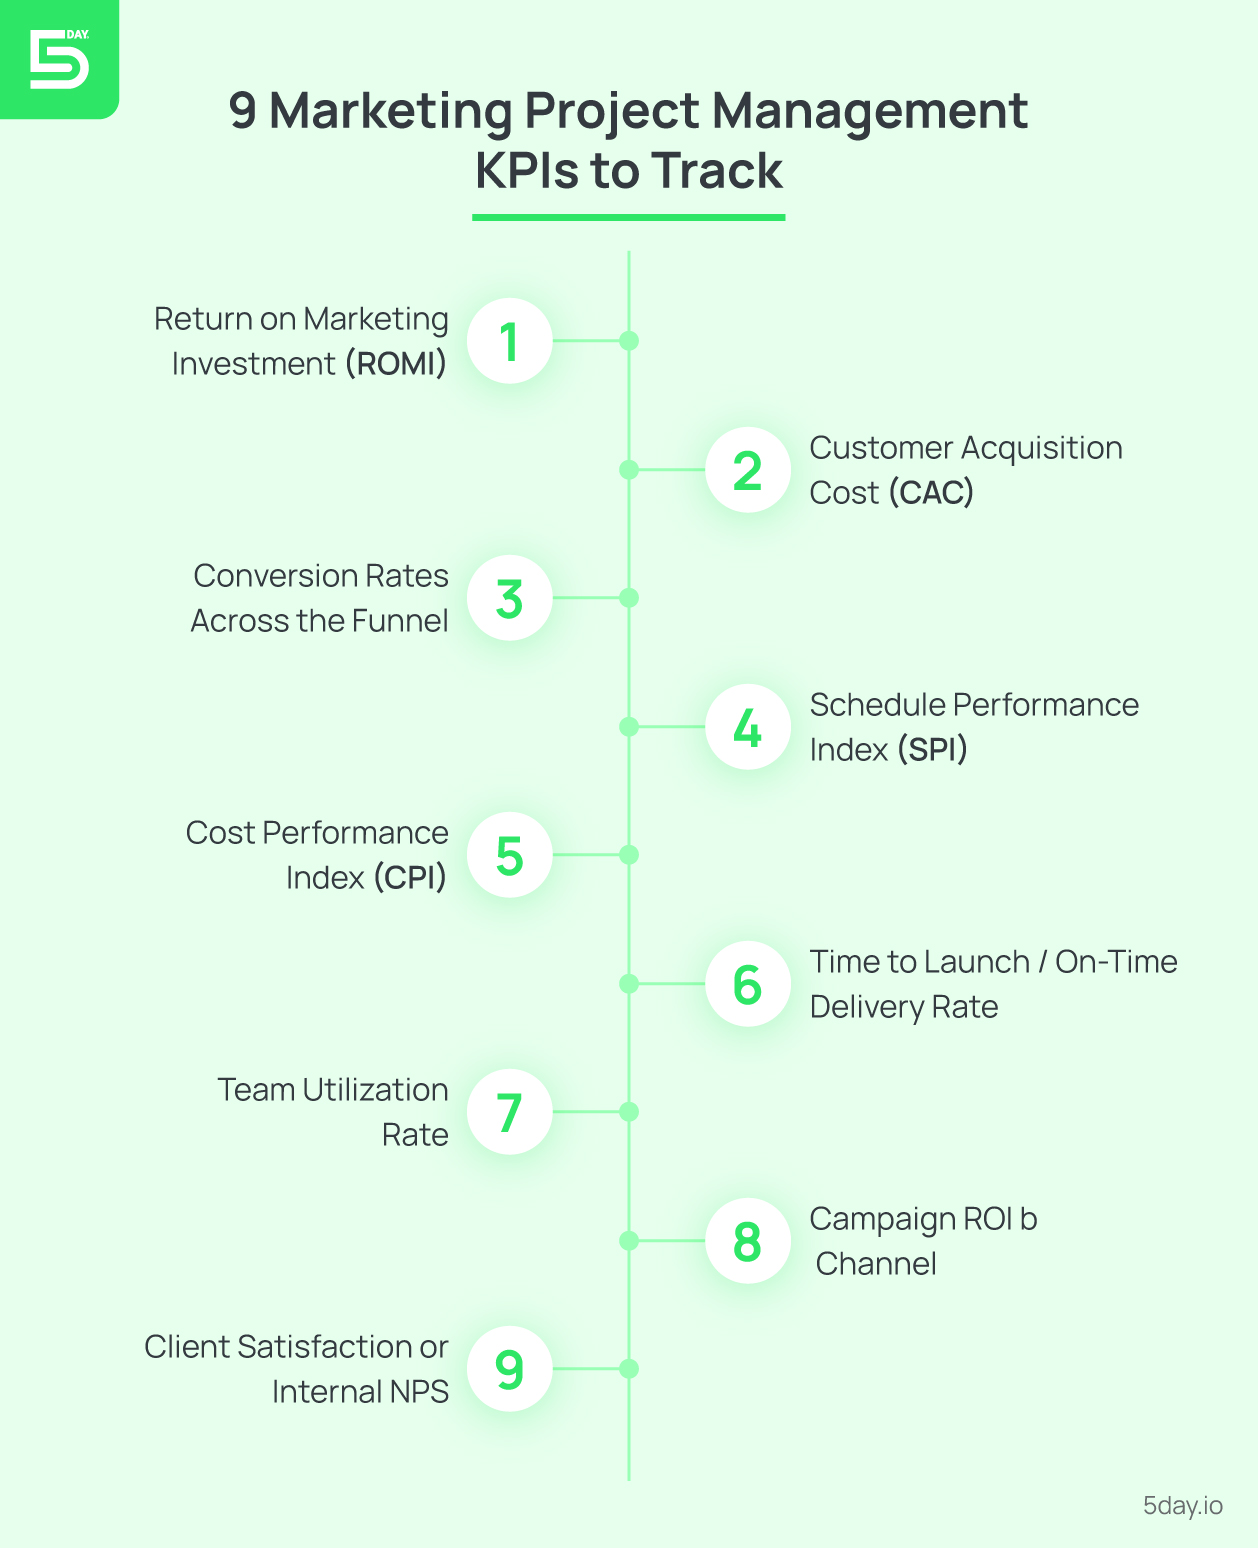
Top 9 marketing project management KPIs

Forget catch-all dashboards. High-performing marketing leaders don’t track everything. They only track the most crucial ones. These KPIs bring operational clarity and help teams stay accountable to both delivery and business outcomes.
Here’s a breakdown of the most impactful marketing KPIs to track in project management, along with how to apply them.
Conversion rates across the funnel
Monitor conversion metrics at multiple touchpoints such as email click-to-open rates, landing page conversion, demo sign-ups, and MQL → SQL conversion.
Despite driving so much traffic, if you miss out on converting that attention into pipeline or revenue, your campaign is underperforming.
Funnel conversion rates help identify where performance breaks down, whether that’s an underperforming CTA or a sales handoff issue.
What it indicates:
A higher rate shows effective targeting and content relevance across stages.
Pro tip: Look for consistent drop-offs in the same funnel stage across campaigns. That’s your optimization starting point.
Time to launch / On-time delivery rate
![]()
Track what percentage of tasks and campaigns hit their scheduled launch date. Also, monitor how long it takes to move a campaign from kickoff to go-live.
Consistent delivery delays distort your planning assumptions. If only 60% of your projects launch on time, you need to recalibrate your workflow estimates or approval process.
What it indicates:
A lower average time to launch and higher delivery rate reflects operational efficiency.
Pro tip: Use this metric to reverse-engineer your scoping process. It reveals if the estimates are too optimistic or if the team underestimated the stakeholder review time.
Team utilization rate
Formula: Time logged on billable or campaign work / total time available
This KPI shows how well your team is using its capacity, and whether they’re stretched too thin. A 95%+ utilization rate might look productive, but it often signals burnout, declining output quality, and higher error rates.
What it indicates:
A balanced rate (typically 75–85%) suggests the best use of team capacity.
Pro tip: Track utilization rate by role and project type. Designers and writers often carry different loads. When one role is over-extended, bottlenecks emerge fast.
Campaign ROI by channel
Measure channel-level ROI for paid search, social ads, organic, email, and affiliate sources.
Without this KPI, you risk spreading spend too thin or scaling the wrong channels. Channel-level ROI lets you double down where returns are strong and cut losses quickly where performance lags.
What it indicates:
Channel-level ROI reveals which platforms deliver the best performance for cost.
Pro tip: Mark spending and outcomes to the same period. The lag between campaign spend and impact can skew results if you don’t account for funnel velocity.
Client satisfaction or internal net promoter scores (NPS)
Gather feedback from clients or stakeholders through surveys, NPS, or post-project reviews.
Delivery metrics don’t always tell the full story. A campaign may hit deadlines and stay within budget, but still leave clients frustrated due to poor communication, lack of visibility, or unmet expectations.
What it indicates:
An NPS above 60 suggests strong client sentiment and agency reliability.
Pro tip: Standardize feedback collection at project close. That way, you don’t just report on what was delivered, you also learn how.
Client retention rate
Formula: ((Clients at end of period – New clients during period) / Clients at start of period) × 100
Acquiring clients is an expensive process and retention is where profitability compounds. Agencies with high retention reduce churn costs and grow through referrals.
This KPI also highlights account health and whether clients see the agency as strategic or tactical.
What it indicates:
Higher retention signals satisfaction and value delivery, which helps build long-term trust.
Pro tip: Find out the reasons behind your churn rate every quarter. If you find patterns, they often link back to unclear scopes or poor reporting.
Cost efficiency
Formula: Total cost per deliverable (or campaign) / Output quality and impact metrics
Marketing agencies operate under margin pressures. Cost efficiency reveals how well the team delivers within scope. It also helps find where overruns happen, and where to tighten operations. Agencies can use it for retainer renegotiations and pricing new work.
What it indicates:
More efficiency means greater output with fewer resources or lower costs.
Pro tip: Include revision rates and internal QA hours when analyzing delivery costs.
Proposal win rate
Formula: Number of Proposals Won / Total Proposals Sent × 100
When you track the win rate, it helps save pitching costs, allowing you to assess how well your marketing agency matches its services to market needs. It also reveals gaps in proposal quality and alignment between client expectations and delivery capabilities.
What it indicates:
A higher win rate suggests that you are clear in positioning, offering competitive pricing and strong proposals.
Pro tip: Compare win rates by service category (e.g., SEO vs. performance media) to improve messaging and team involvement.
Customer lifetime value
Formula: Average Retainer Value × Average Retention Duration (in months or quarters)
CLV reframes the conversation from short-term deliverables to long-term partnership value. It helps agencies decide how much to invest in retention, upsell, and client success.
It’s particularly useful when deciding whether to prioritize high-effort company accounts or smaller, more scalable ones. Tracking CLV also supports smarter budgeting around client retention strategies, onboarding investments, and account-based marketing.
What it indicates:
An upper limit CLV value shows stronger relationship and long-term probability.
Pro tip: Add qualitative data to CLV reviews (such as account expansion, referrals) to capture full value.
Key marketing project management KPI examples
To understand in depth, let’s look at some project management KPI examples:
-
Conversion rates across the funnel example
Top-of-funnel example (form awareness to engagement)
Let’s say, your paid LinkedIn campaign brings 10,000 impressions and 500 clicks to a gated ebook.
Conversion Rate = (500 ÷ 10,000) × 100 = 5% CTR
5% CTR shows that your ad creative and targeting are delivering effective results. Your team might need to A/B test the hook or CTA to improve CTR to increase the conversion rates.
Bottom-of-funnel example (starting from demo to closing the deal)
Out of the 75 people who booked demos, 12 converted into paying customers.
Conversion Rate = (12 ÷ 75) × 100 = 16%
It shows a strong sales handoff or nurturing process. But if this drops below 10%, your team might want to revisit qualification criteria or lead scoring models.
-
Customer lifetime value (CLV) example
Let’s say your marketing agency works with a SaaS client who pays $8,000 per month for performance marketing services. On average, clients like this stay for 18 months.
CLV = $8,000 × 18 = $144,000
Now compare this with a one-off campaign client who pays $20,000 for a 3-month engagement.
The long-term SaaS client may seem less lucrative at first glance, but their CLV proves they’re nearly 7x more valuable and likely more cost-effective to retain.
How project management tools help track and report marketing campaign KPIs?
Tracking top marketing KPIs in disconnected spreadsheets or siloed platforms is where most systems break. If your marketing work touches five tools, your data probably lives in eight places.
Modern tools help solve this by bringing execution and performance tracking into a single platform. Here’s how it helps KPI tracking for marketing teams:
|
Feature |
How it helps KPI tracking for marketing |
|
Real-time dashboards |
Live visibility into SPI, CPI, deadlines, and campaign progress |
|
Built-in timesheets |
Track utilization, billable hours, and resource burn |
|
Automation & alerts |
Notifications for deadline slippage, over-budget risks, and overdue tasks |
|
Role-based views |
Custom dashboards for execs, clients, and teams—without overwhelming anyone |
|
Task & subtask breakdowns |
Track performance at granular or macro levels |
|
Reporting templates |
Standardized campaign reports, budget rollups, and project performance logs |
5day.io connects every marketing KPI to the actual work, so you don’t have to rebuild it in Excel at the end of the month.
Why choose 5day.io for managing marketing projects?

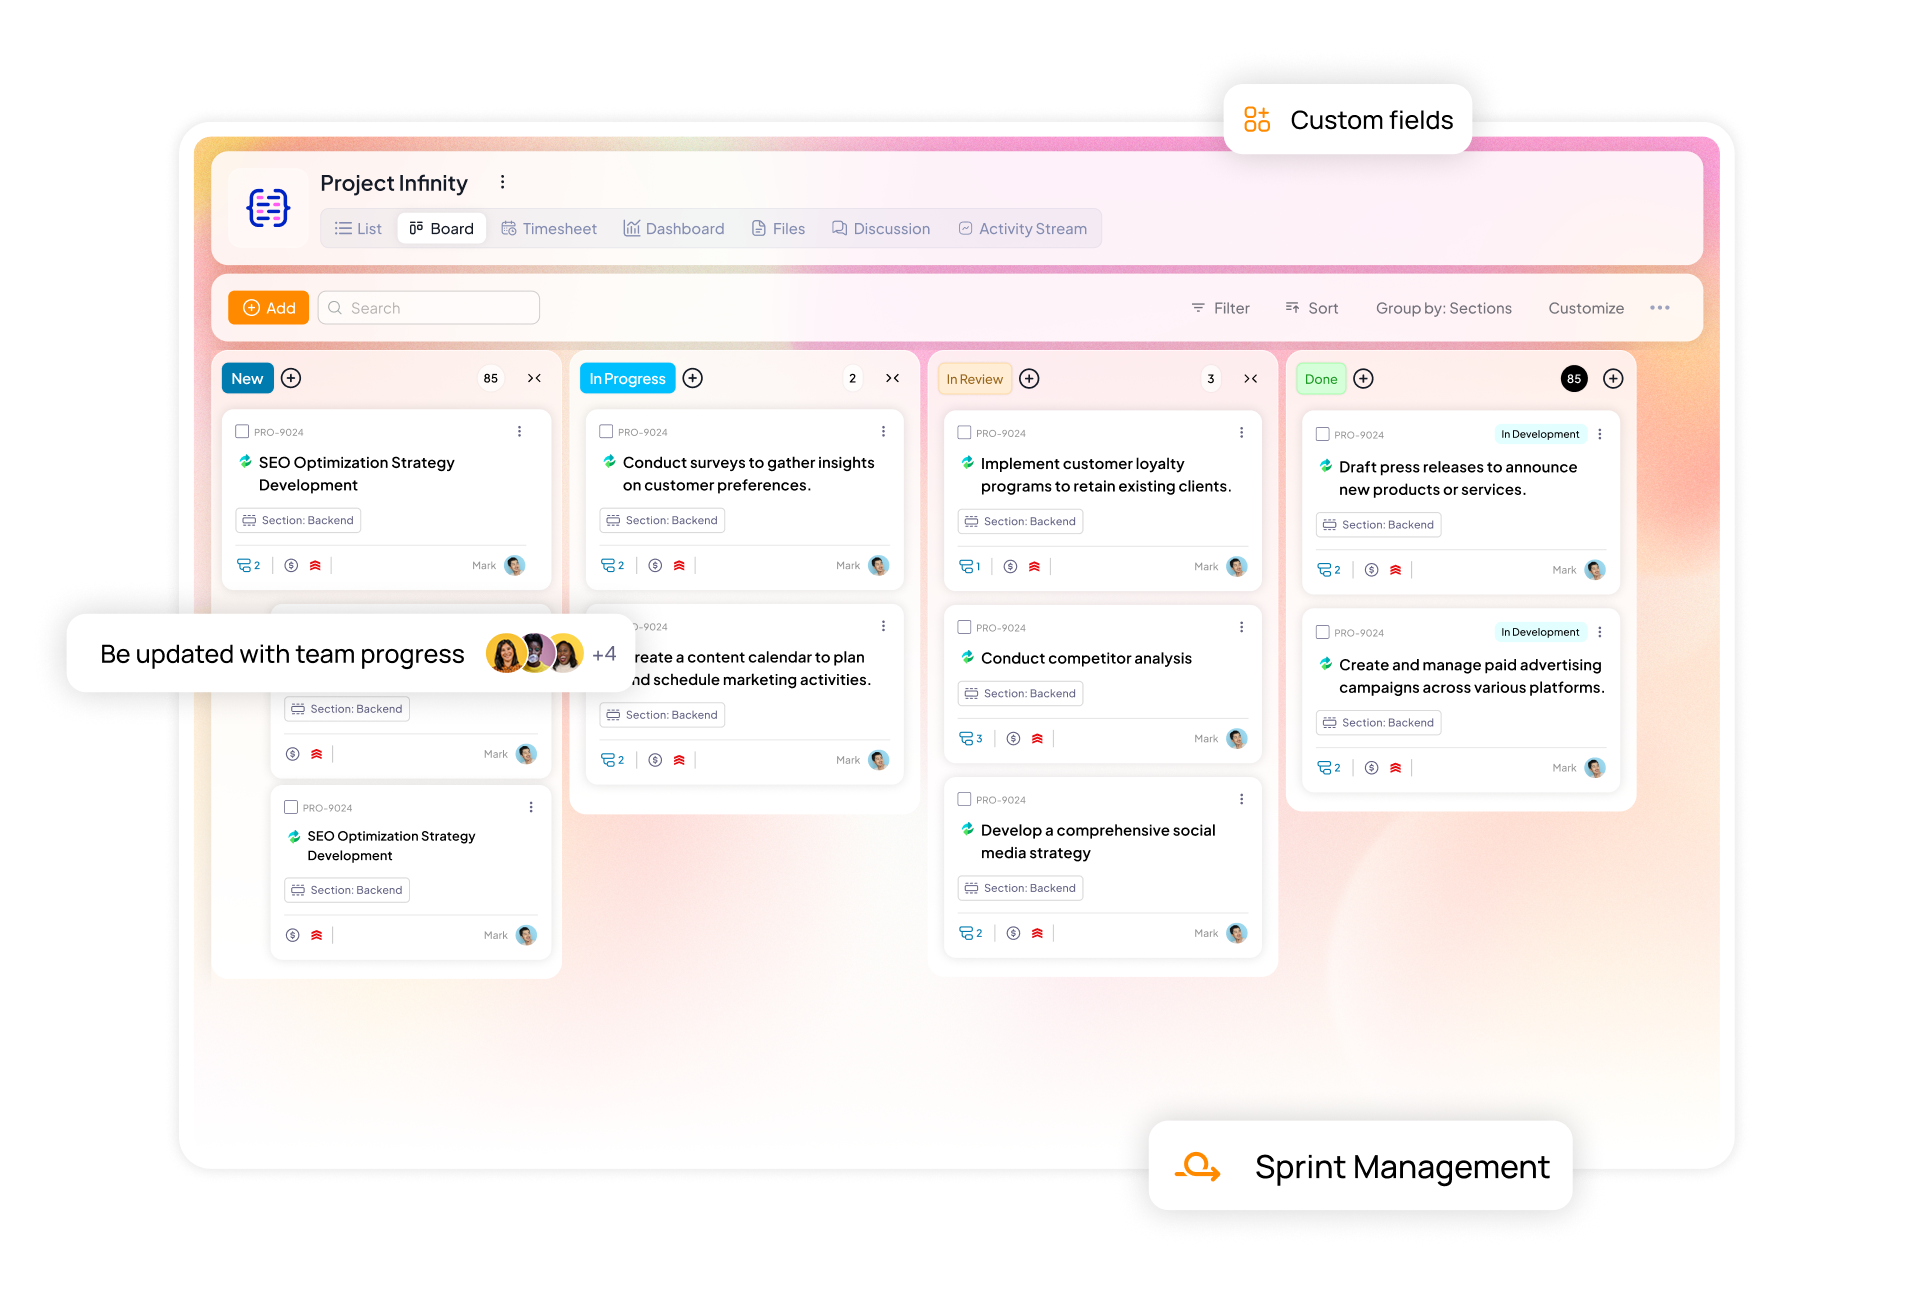
Marketers who’ve outgrown spreadsheets need a system built for velocity, visibility, and validation. 5day.io is purpose-built for marketing project workflows. Here’s what sets it apart for mature teams:
- Stay aligned with clear project plans and timelines
- Break complex campaigns into trackable phases and deliverables
- Spot blockers before they affect delivery
- Centralize discussions, feedback, and task ownership
- Keep projects on schedule without getting buried in status meetings or spreadsheets
In other words, 5day.io helps you manage the work behind the marketing KPI metrics, so when it’s time to report performance, you’re not relying on scattered notes or memory. You’re already one step ahead.
Don’t just track performance, instead, improve how you deliver it. Start managing your marketing projects with 5day.io. Try it for 30 days free – no credit card needed.
FAQs
What categories of KPIs should project managers track?
Project management KPIs typically fall into three core categories:
- Delivery KPIs: Metrics like on-time delivery rate or time to launch help you maintain momentum and keep client expectations in check
- Impact KPIs: Funnel conversion rates, campaign ROI by channel, client satisfaction, and client retention rate help show tangible results of your agency
- Workload & execution KPIs: Utilization rate, billable vs. non-billable hours, and task completion ratios reveal how well teams manage capacity and deliver work
Advanced teams also layer in campaign performance metrics, such as proposal win rate and cost efficiency, to improve operations and grow with a steady pace.
What’s the most effective way to monitor KPIs in a marketing project?
Start by identifying KPIs that directly support your strategic goals. Once you’ve defined them, use a centralized project management tool like 5day.io to reduce manual reporting and link project data with campaign results.
Set baselines for delivery metrics, like 90% on-time delivery, 75% average utilization, using your project scope, timeline, and budget. Create consistent reporting cadences based on the project’s pace, weekly for short sprints, and monthly for long-running programs.
Create alerts to flag risk in real time, whether that’s a missed milestone or a budget overrun.
How can you evaluate the true success of a marketing project?
Successful projects not just hit deadlines but also deliver value. To measure real success, start by tracking whether your team delivered the project within the planned scope and timeline.
Then, evaluate campaign outcomes, like conversions, leads generated, or marketing ROI. Monitor internal performance through utilization and workload data to prevent burnout and inefficiencies.
Review historical execution trends to see if you’re improving speed or resource usage over time. Once you share the reports, gather structured client or stakeholder feedback to confirm satisfaction.
When you connect delivery metrics to outcomes and use that data to improve, you shift from checking boxes to creating a measurable impact.


