


Your marketing dashboard has forty numbers on it, but only three of them matter.
The hard part about tracking marketing operations KPIs in 2026 is knowing what’s worth measuring. AI has made output cheap, so the real question changes from how much your team ships, to whether the right work is moving through your pipeline efficiently.
As marketing teams face tighter budgets and higher expectations, operational efficiency has become a competitive advantage. According to Gartner, marketing budgets fell from 9.1% of company revenue to 7.7%, making it more important than ever to identify and eliminate operational bottlenecks.
Most KPI lists focus on marketing performance metrics like traffic, leads, and ROI. This guide focuses on the operational KPIs that reveal how work flows through your team and where execution slows down. Tracking these metrics will help you deliver campaigns faster, more consistently, and with fewer resources.
Marketing KPIs vs. Marketing Operations KPIs: What’s the Difference?
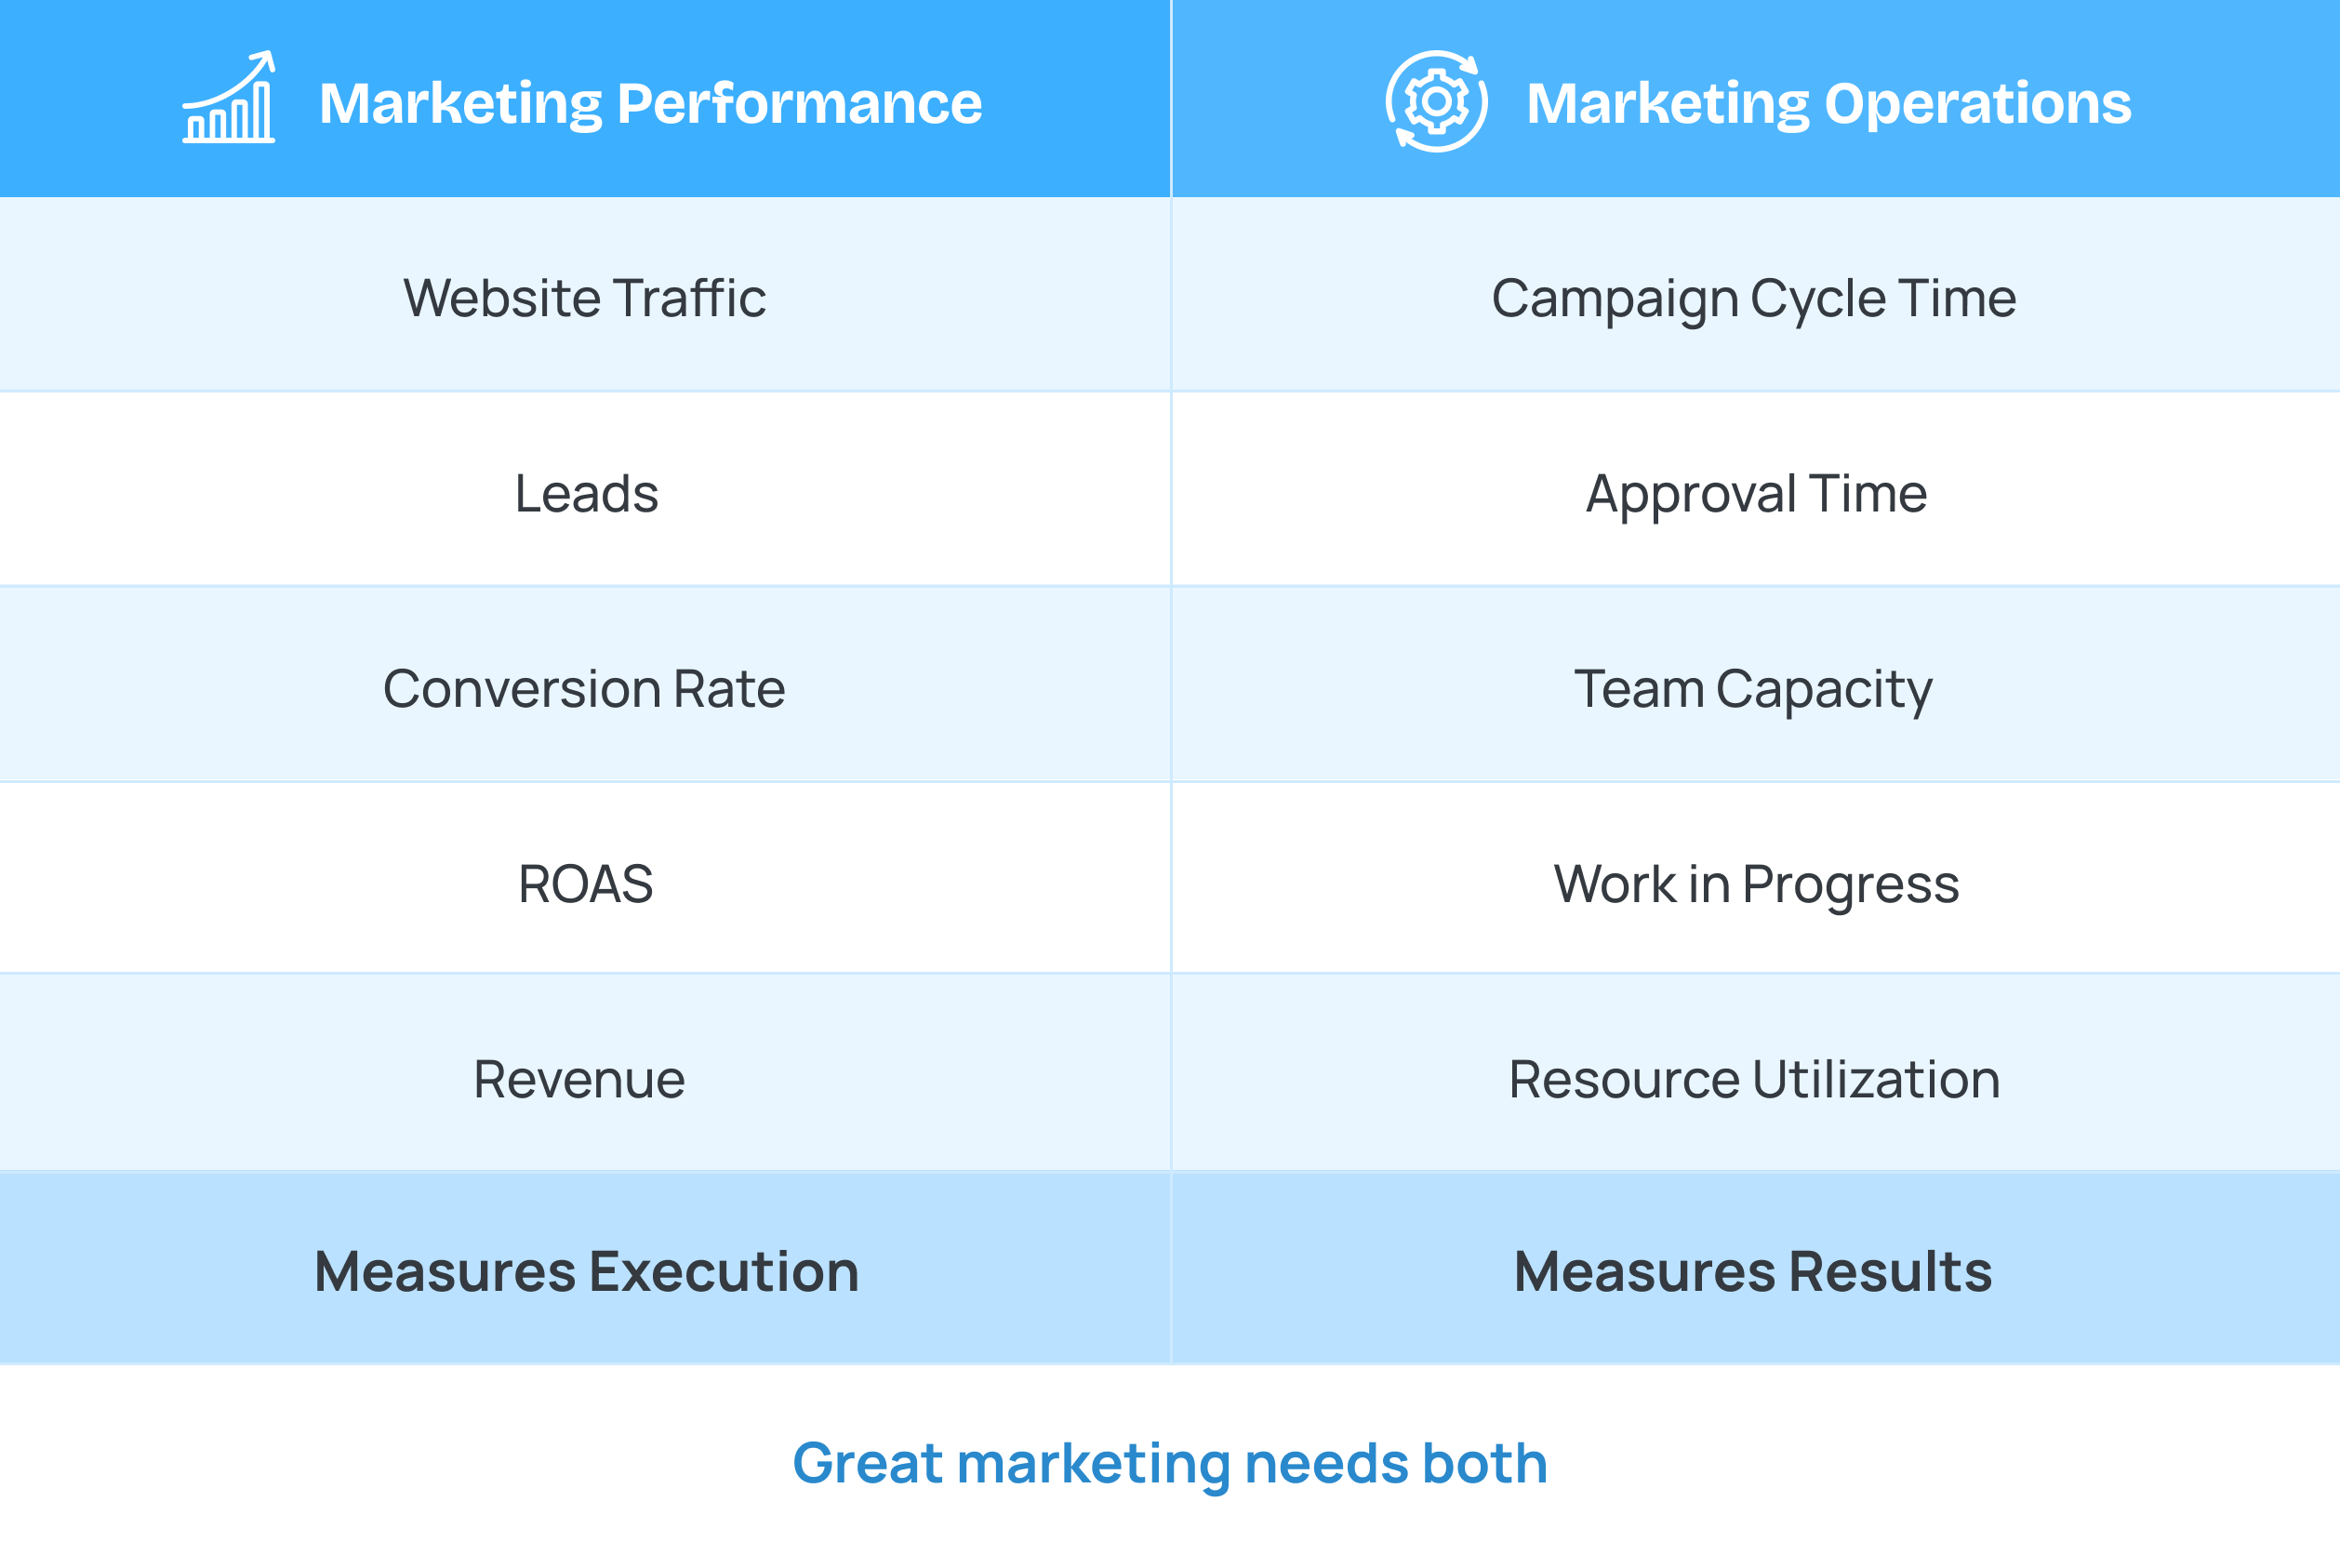
Understanding the difference between Marketing KPIs and Marketing Operations KPIs is essential if you want to improve both marketing performance and operational efficiency.
Marketing KPIs tell you how your marketing performed. Think website traffic, leads, conversion rate, or ROI. They’re outcome-based metrics that measure the results of your campaigns. Marketing Operations KPIs, on the other hand, measure how efficiently your team delivers that work. These marketing operations metrics track everything from campaign delivery and approval turnaround time to workload distribution and resource utilization.
McKinsey’s research found that while nearly every organization is investing in AI, only 1% of leaders say AI is fully integrated into workflows and delivering substantial business outcomes. For most organizations, the challenge is improving the operational systems that allow teams to execute consistently. Marketing Operations KPIs help measure exactly those systems.
Here’s why you need both. Say a campaign ships two weeks late. Your performance numbers show the damage, like fewer leads, a missed target but not the cause. The operational numbers do: approvals sat for a week, design was buried, five campaigns were live at once.
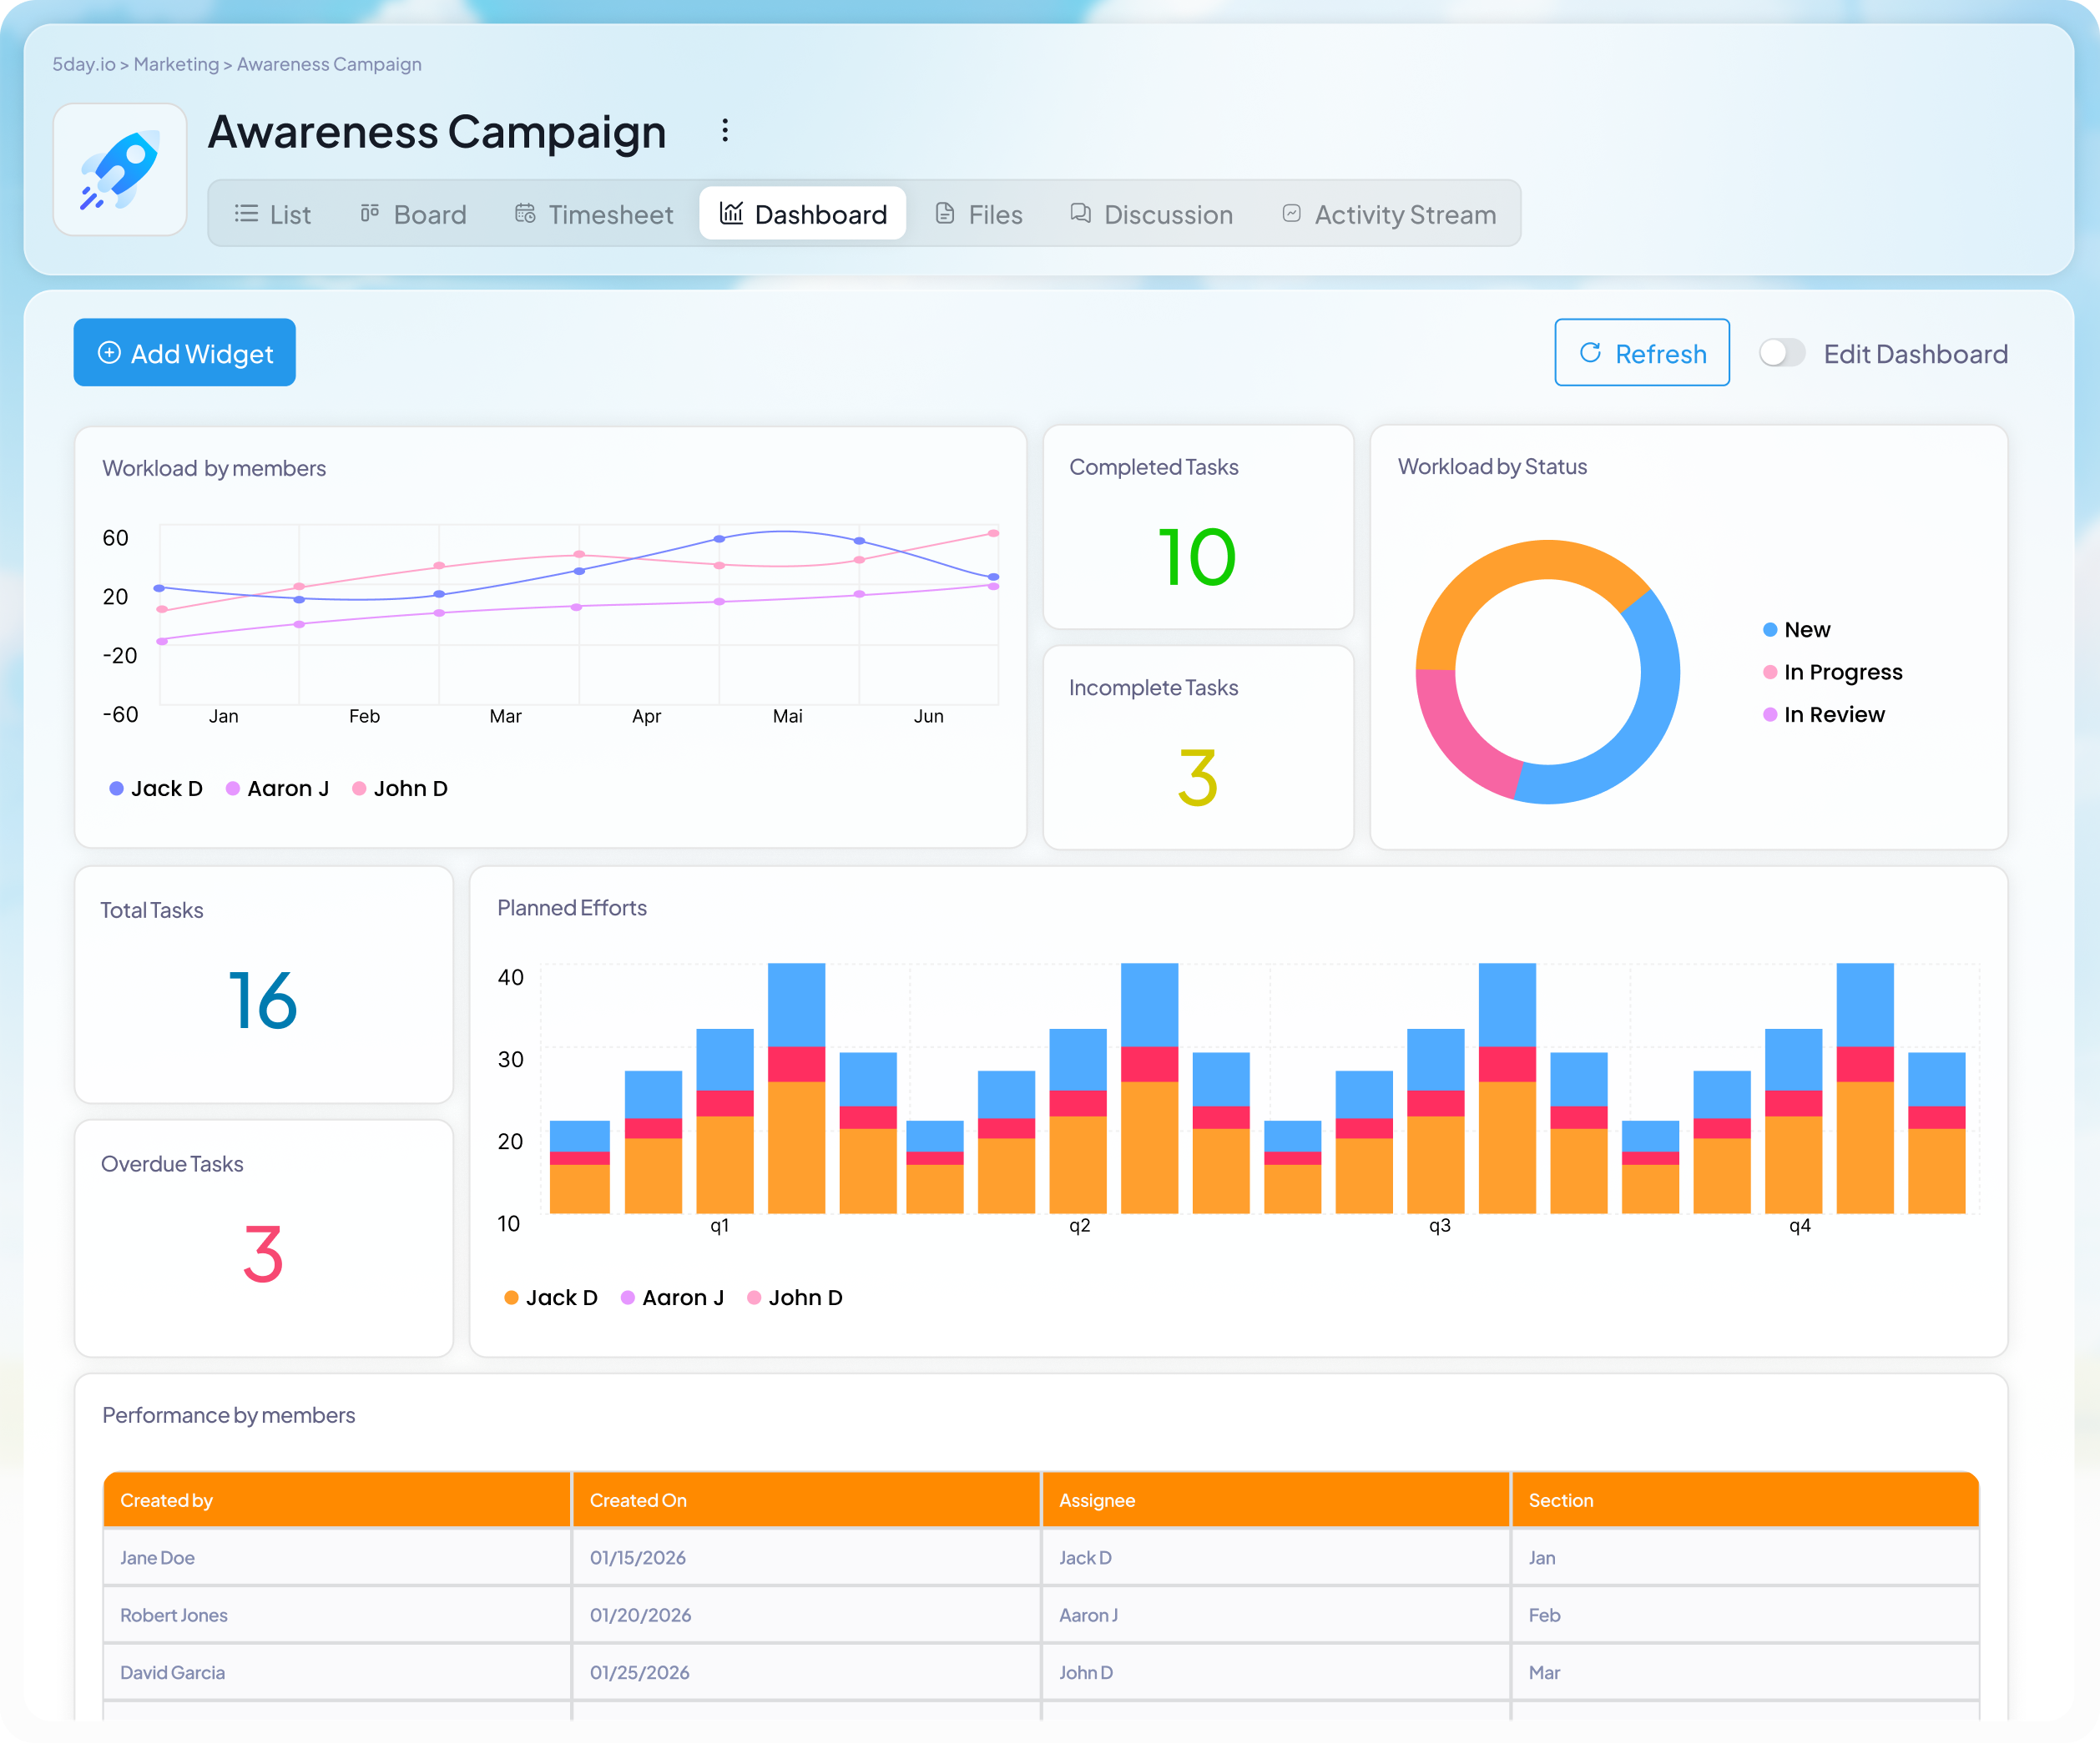
While many teams track these metrics manually across spreadsheets and disconnected tools, a dedicated marketing operations platform like 5day.io makes it easier to monitor workflows, approvals, capacity, and campaign delivery from a single place.
That’s the whole distinction. Performance KPIs tell you what happened. Operations KPIs tell you why. The best teams track both but if your goal is to fix execution rather than just report on it, the operational side is where the leverage is, and it’s the half this guide spends the most time on.
Importance of KPIs & Metrics in MarketingOps
For a long time, marketing was judged on output and instinct; the campaign either landed or it didn’t. Marketing operations exist to change that. It treats marketing as a system to be run: briefs, approvals, handoffs, capacity, and delivery, all working together or breaking down together. And the first rule of running any system is that you can’t manage what you can’t see.
That’s the job KPIs do in Marketing Ops, they make an invisible process visible. Specifically, they:
- Turn complaints into fixable problems: “The launch felt slow” becomes “cycle time went from nine to sixteen days, all of it in approvals.” One you can act on; the other you just grumble about.
- Let you manage what you can’t personally watch: As teams and agencies grow, you can’t sense where work is stuck by walking around, there’s too much in flight. This is why project management for marketing has become inseparable from measurement.
- Create a shared, factual picture: Everyone sees the same view of how work is moving, without interrupting five people to assemble a status update.
- Catch problems before they hit results: Operational metrics move before performance ones do, so a rising bottleneck shows up while there’s still time to fix it.
- Make the numbers a byproduct of the work: A project management platform built for marketing captures cycle time, capacity, and delivery automatically as briefs, handoffs, and campaigns move through it, no manual reconstruction.
Ultimately, metrics turn marketing operations from a title into a discipline. They close the loop; measure, find the bottleneck, fix it, measure again and that lets a team get faster and more reliable over time instead of just busier.
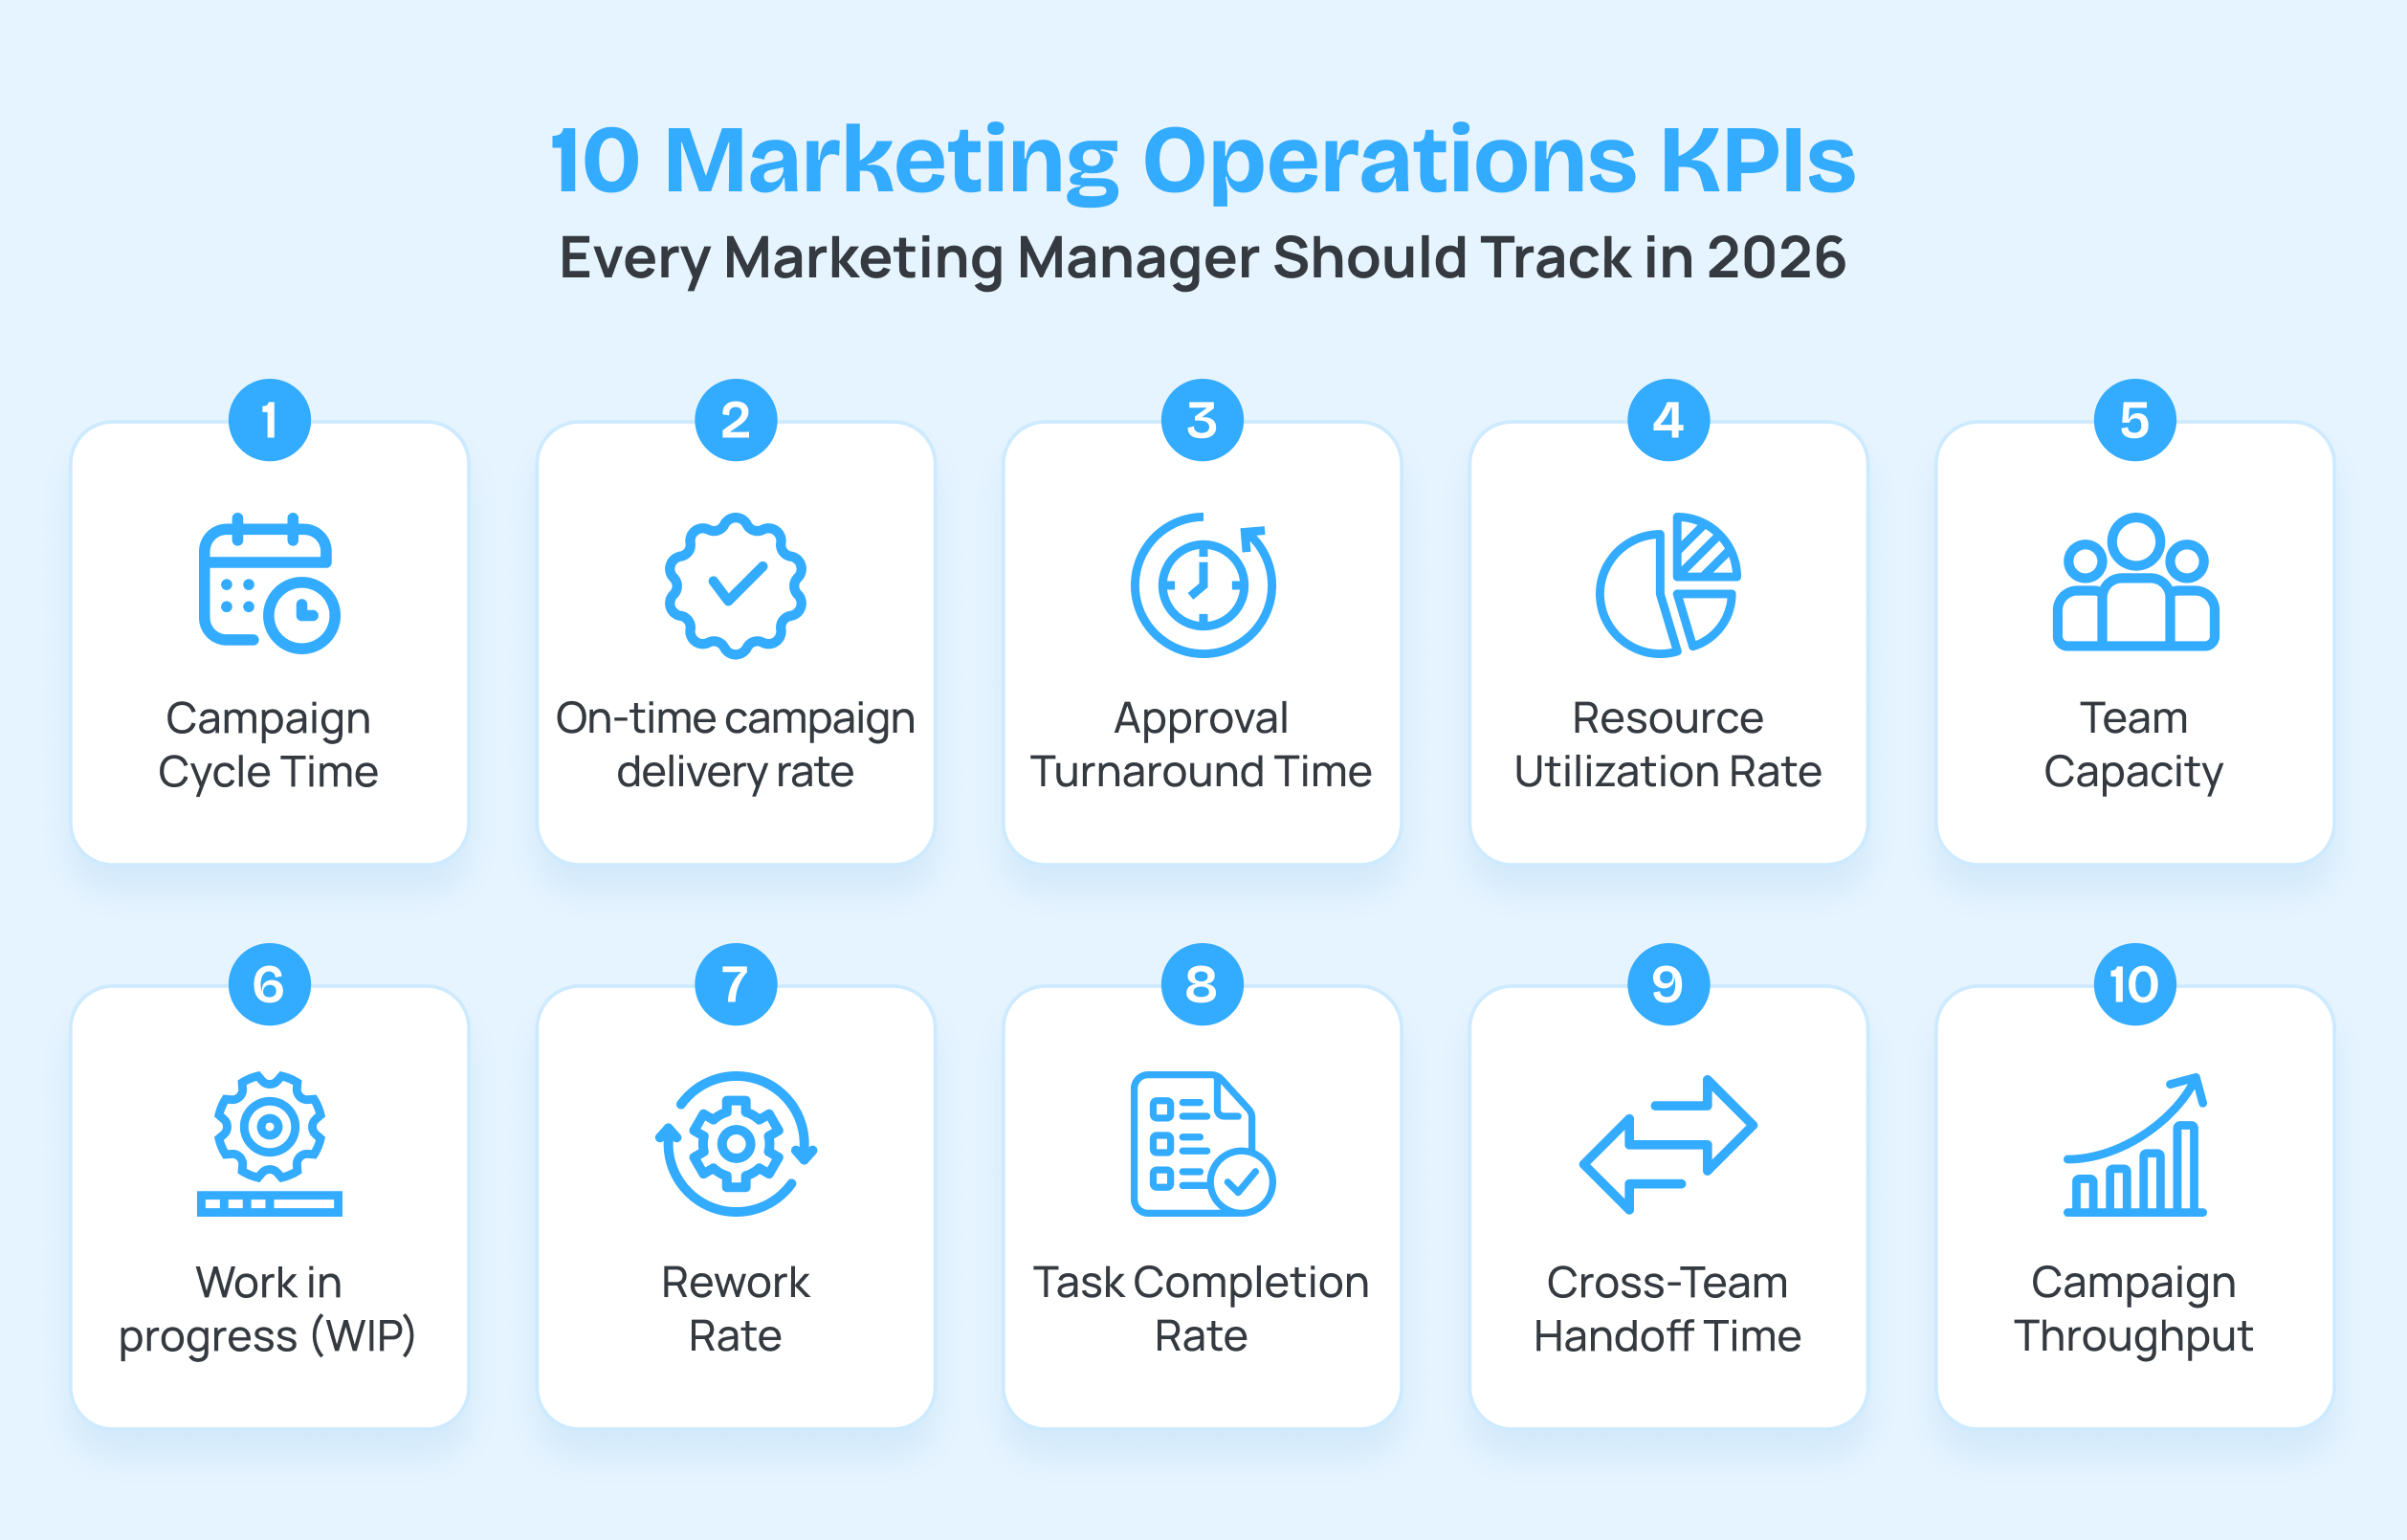
10 Marketing Operations KPIs Every Marketing Manager Should Track in 2026
Campaign Cycle Time
Campaign cycle time is one of the most important Marketing Operations KPIs because it measures how long it takes for a campaign to move from request to launch. Among the many marketing operations metrics teams track, this one provides a clear view of how efficiently work flows through your marketing process.
If launching a campaign typically takes four weeks but suddenly starts taking six, it’s a sign that something in your workflow needs attention. The insight almost always comes from breaking it into stages; request, briefing, production, review, launch because that’s when teams discover their work spends most of its life waiting rather than being worked on.
For example, a social campaign is requested on the 1st, briefed on the 3rd, and designed by the 8th. It then waits for review until the 12th, goes through another round of edits, and launches on the 16th. Although the cycle time is 15 days, only four days were spent producing the work. The remaining time was lost to review queues and handoffs. That’s the point of measuring it: cycle time tells you where the time goes, almost always “waiting,” not “working.” Which is why the fix is rarely making people work faster.
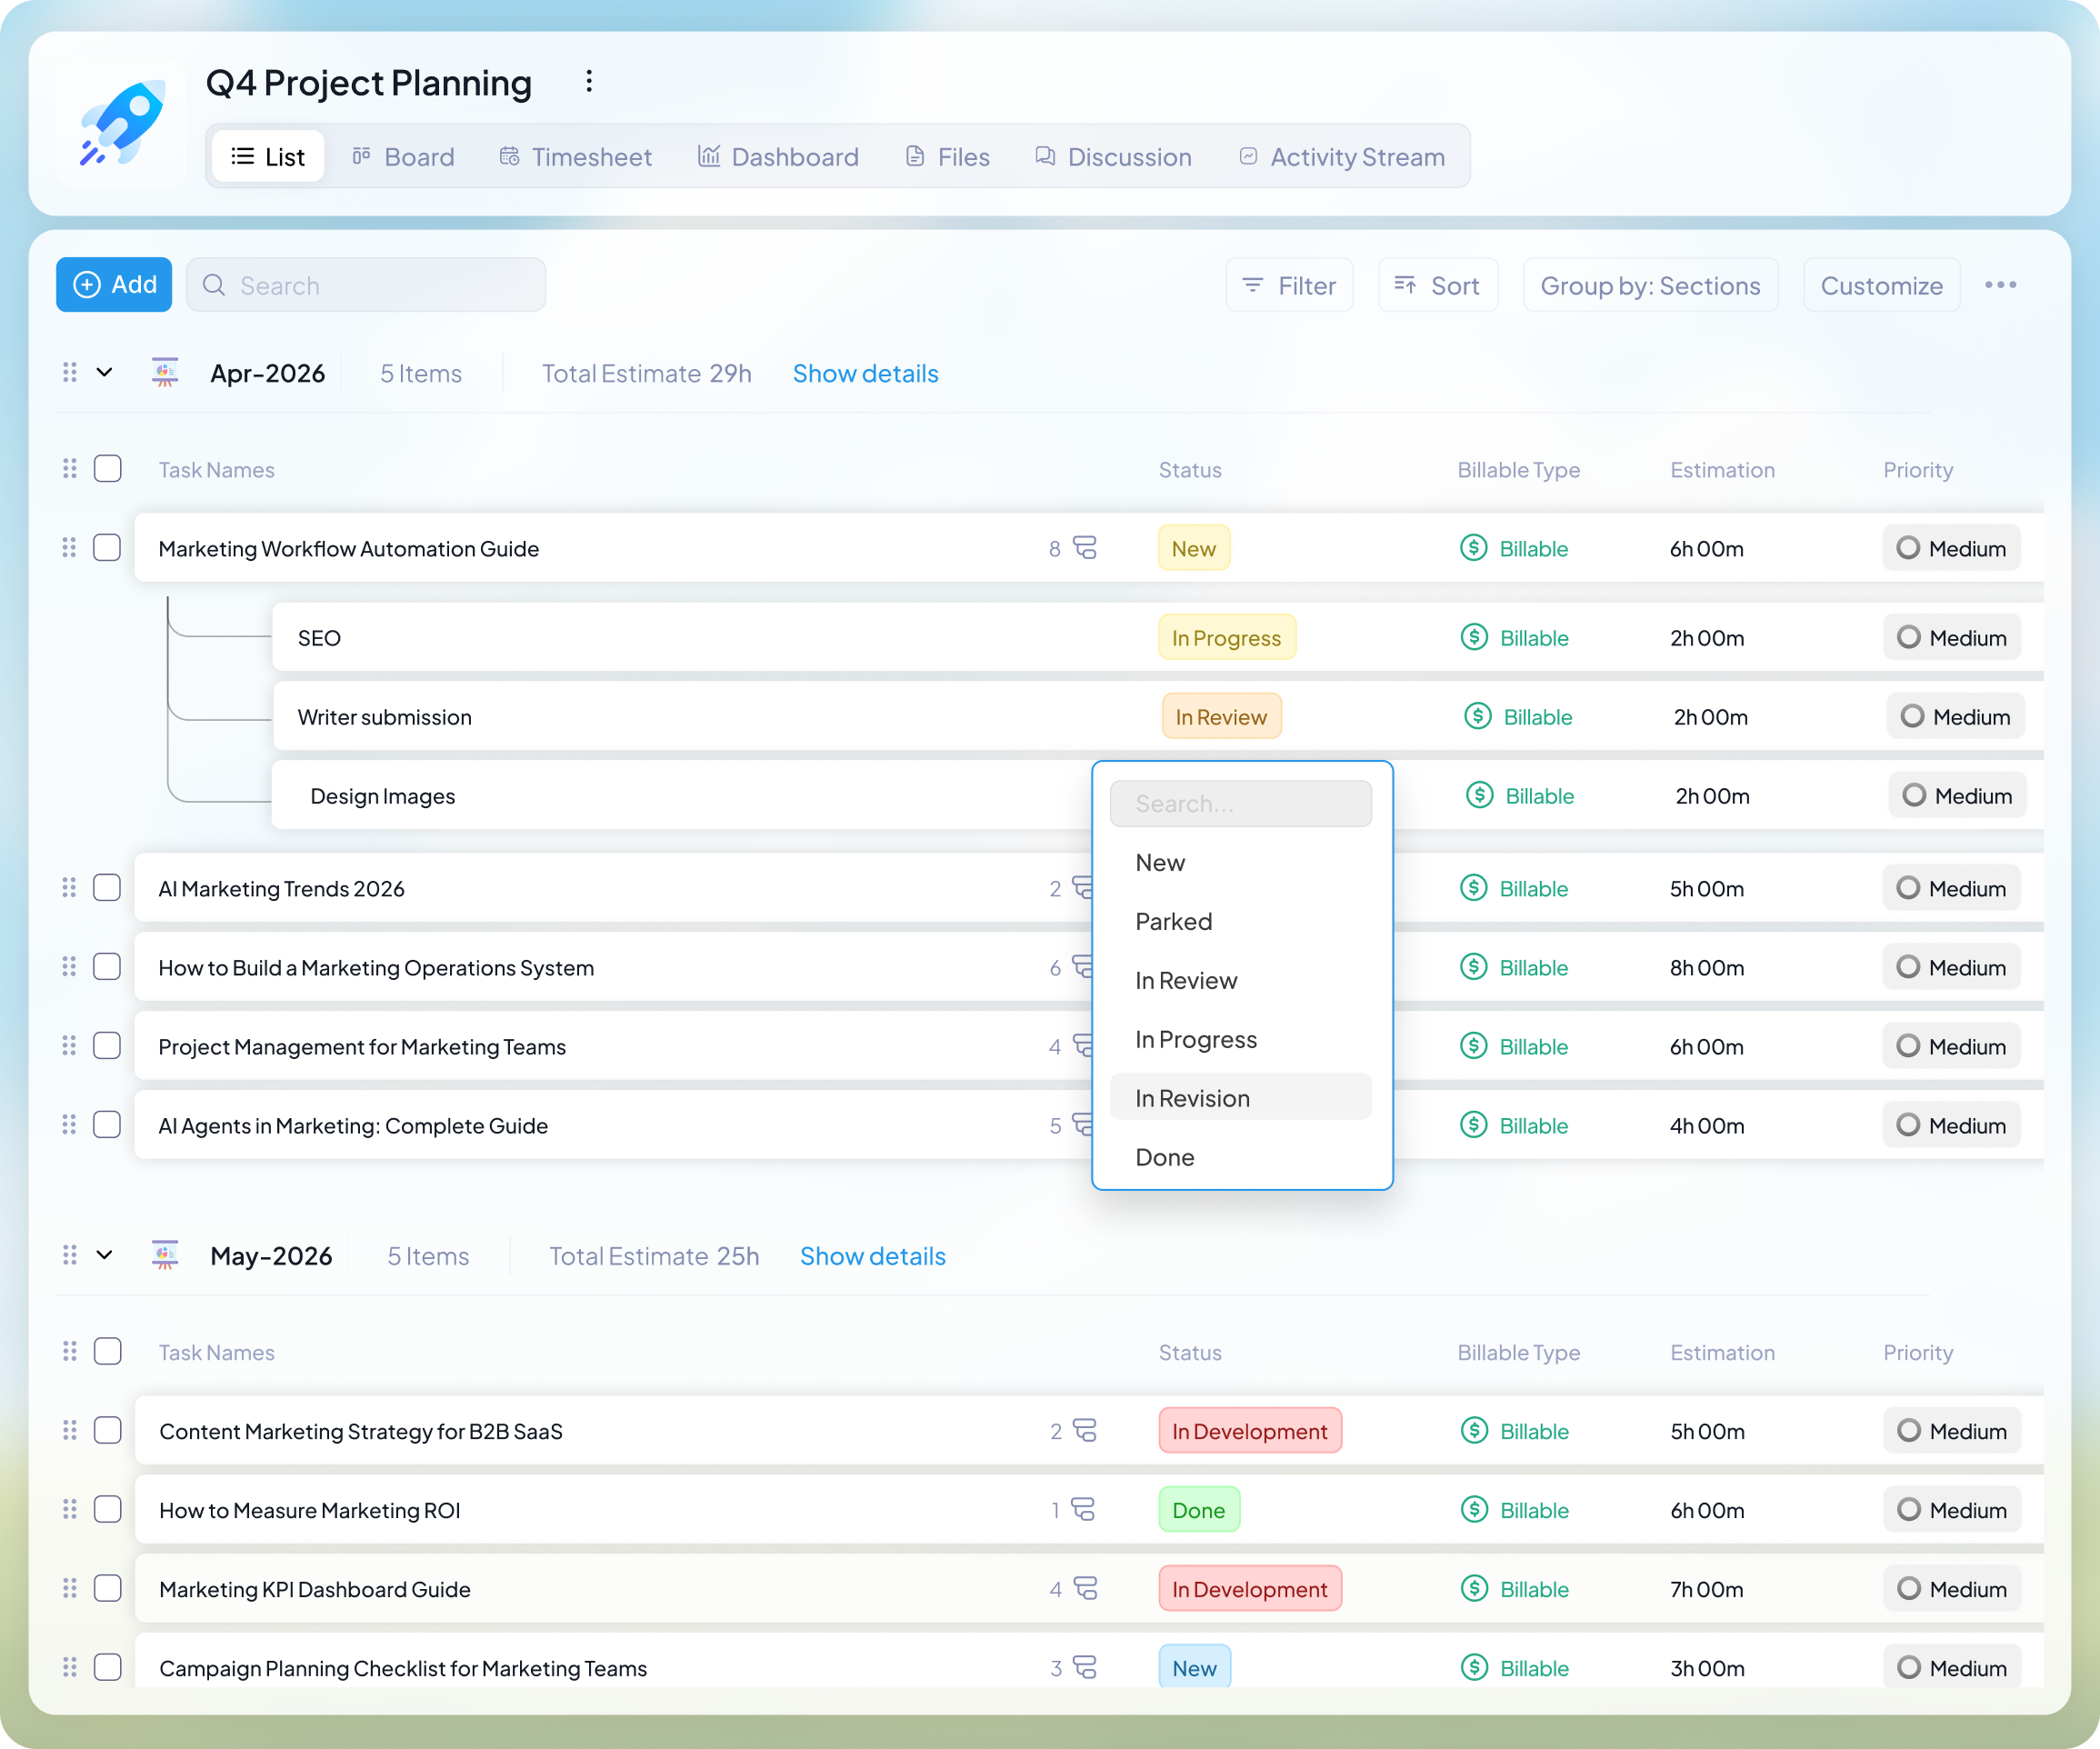
How to improve it: Track the trend, not the absolute number. Segment by campaign type so an email and a launch aren’t averaged into a meaningless middle. Then attack the waits, not the work: set turnaround expectations on reviews, and trigger the next stage the moment the last one finishes instead of letting work sit until someone notices it’s ready.
On-time campaign delivery rate
On-time campaign delivery rate measures the percentage of campaigns your team launches on or before their planned deadline. It reflects how consistently your marketing team delivers work as scheduled and is one of the most reliable KPIs for marketing ops, helping managers measure operational consistency over time.
Marketing campaigns are often tied to product launches, sales initiatives, seasonal promotions, or customer communications. When deadlines slip, the impact extends beyond marketing, affecting other teams and business goals.
A team that ships in ten days every time is more valuable than one that averages seven but swings between three and fifteen. The predictable team lets sales promise launch dates, lets you sequence campaigns with confidence, lets everyone downstream plan. The fast-but-erratic team forces everyone to pad their own timelines defensively, which slows the whole system down.
A missed date is only a failure if you learn nothing from it. Log why each one slipped and the reasons cluster fast; late approvals, mid-campaign scope changes, a dependency that wasn’t ready, and those clusters are your actual to-do list.
How to improve it: Set the date after a quick capacity check, not before. And review slips monthly by cause, not by campaign. Fixing the top recurring reason moves the number far more than chasing any single late project.
Approval Turnaround Time
Approval turnaround time measures how long it takes for stakeholders to review and approve marketing assets before they move to the next stage of the workflow. This marketing operations metric is usually the single biggest and most fixable chunk of total cycle time. The maddening part is that the work is done. Nothing is being produced, improved, or blocked by a hard problem. It’s just parked, waiting for someone to look at it.
For example, a blog post may be written and designed within three days but remain stuck in review for another five. If this becomes a recurring pattern across projects, approvals become a bottleneck. It’s one of the clearest examples of operational KPIs showing where work slows down, even when production itself is efficient.
The tell is simple: if approvals routinely take longer than producing the work did, your bottleneck is the review process. Adding hours or people to production won’t change it, you’d just be producing work faster for it to sit in the same queue. The usual culprits are too many approvers in the chain and no agreed turnaround on feedback, so review becomes whatever’s left after everyone’s “real” work.
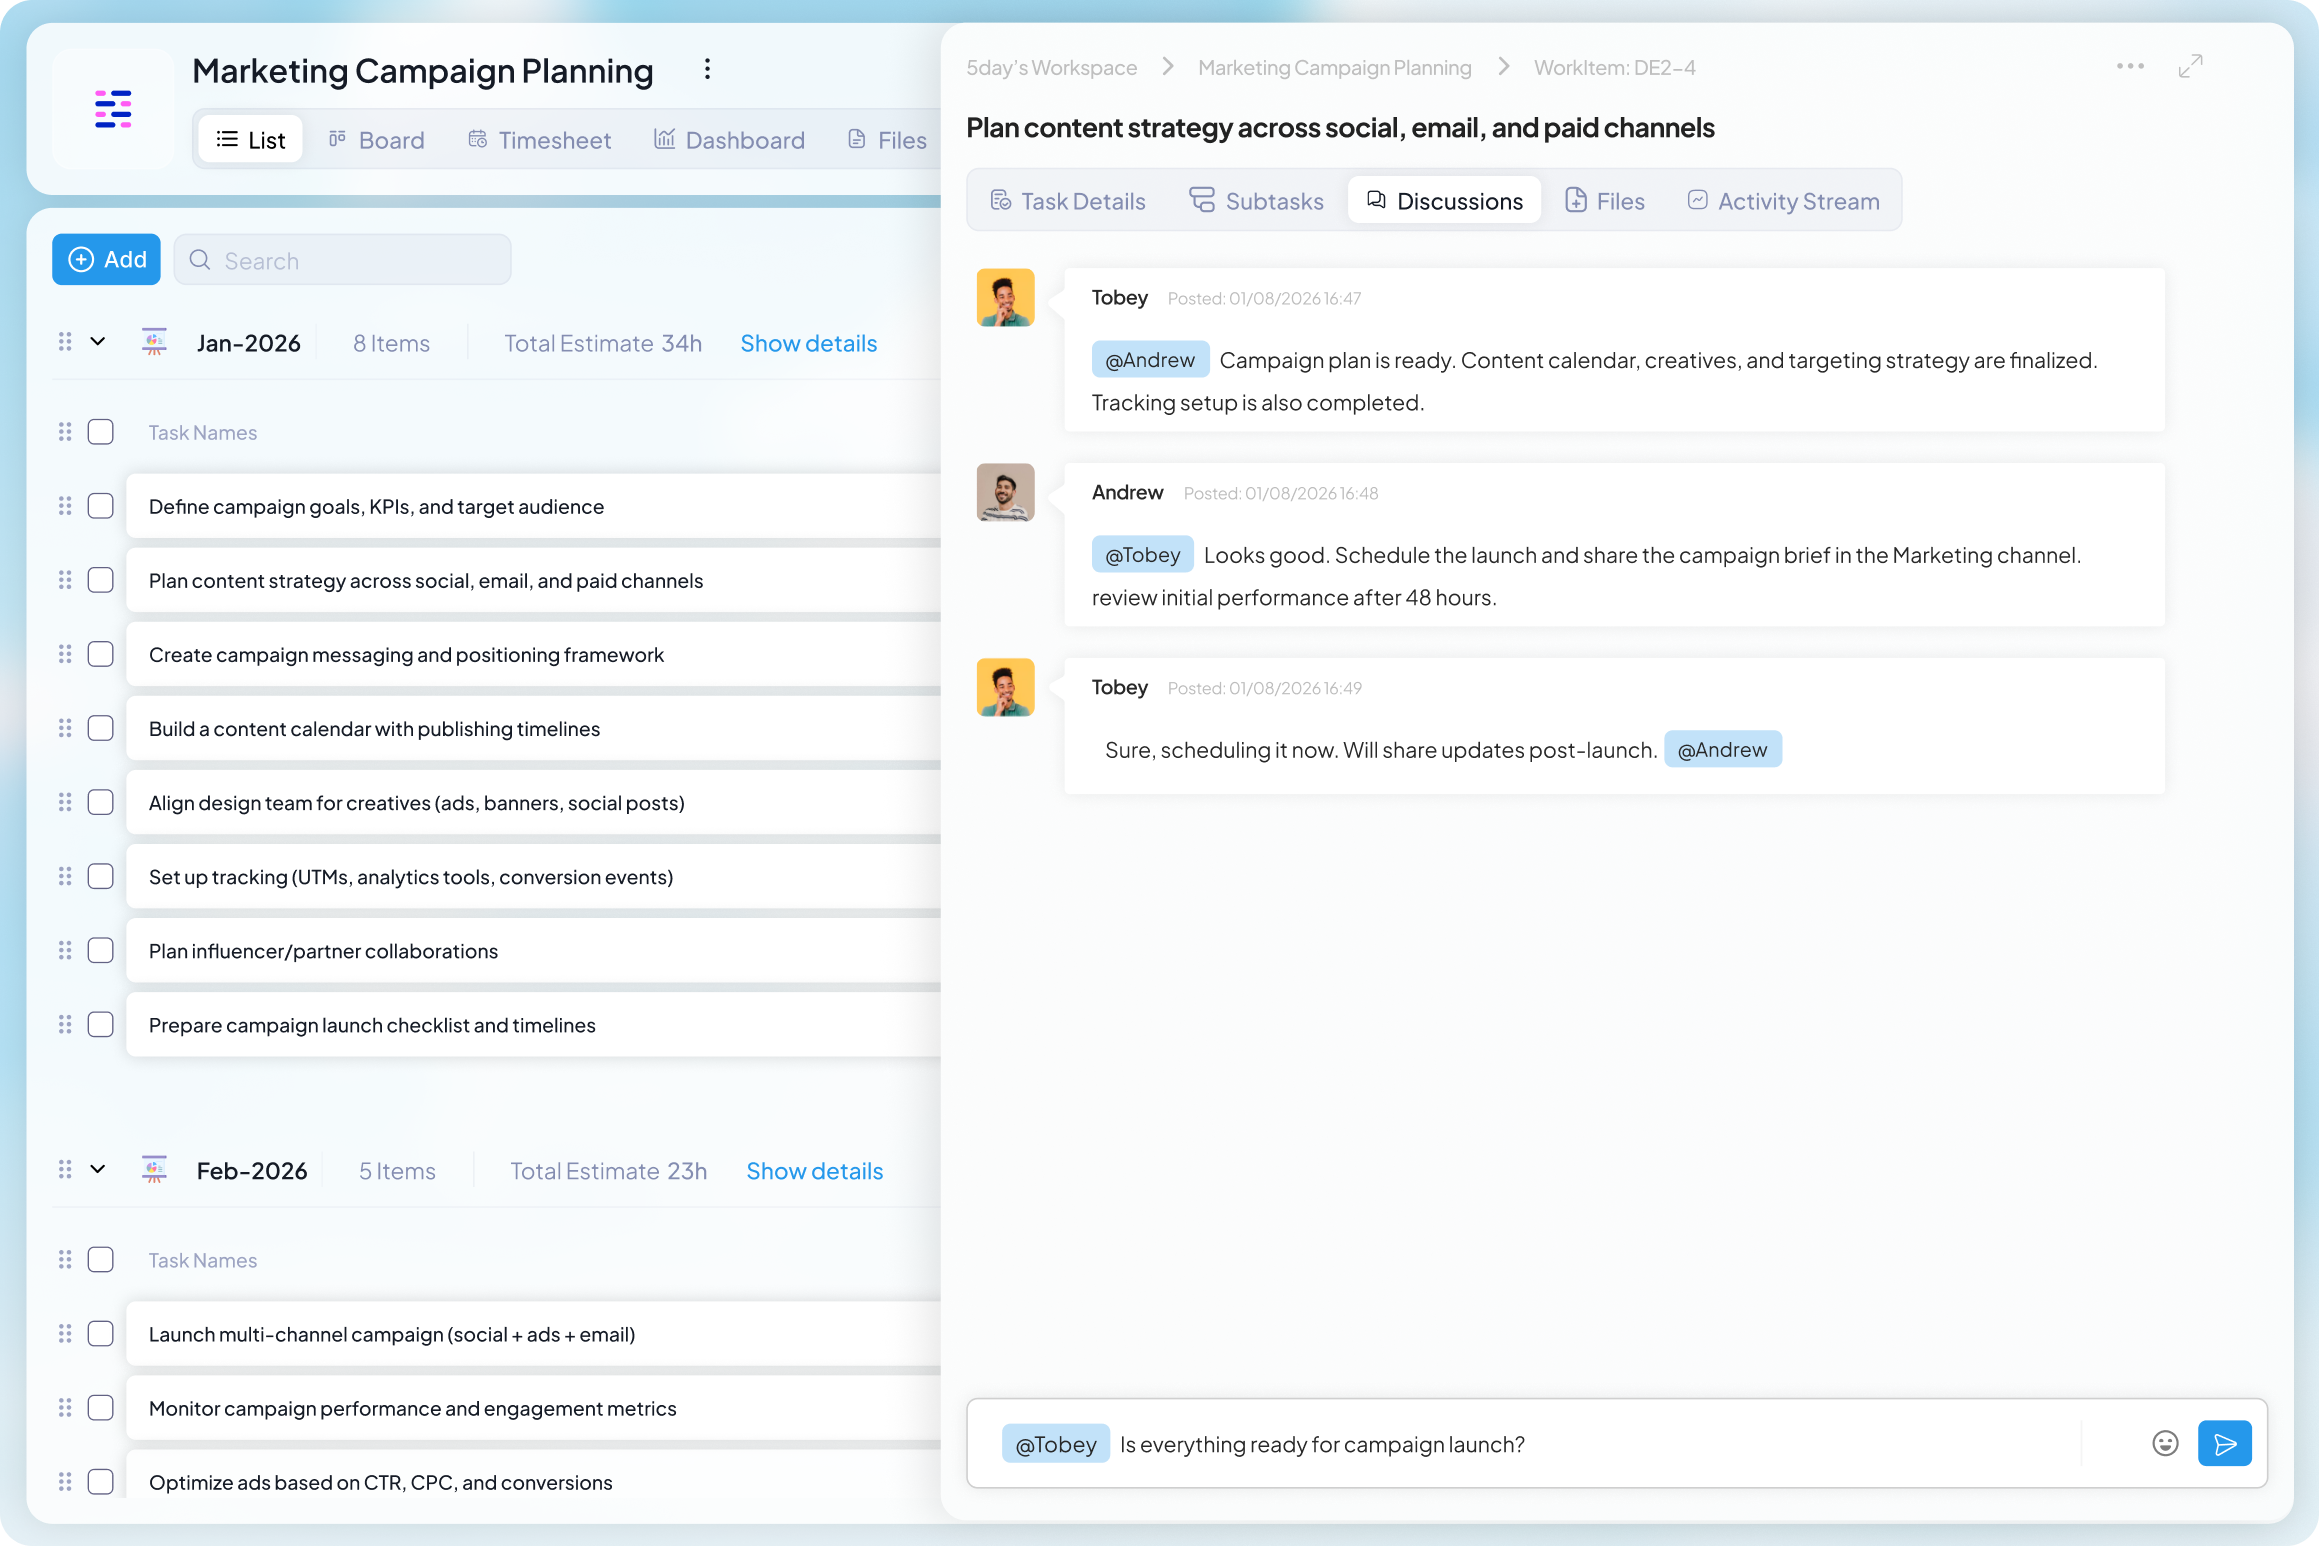
How to improve it: Name one accountable approver per deliverable instead of a committee, and set a standing turnaround expectation (say, 24–48 hours) so review is a commitment. For anything low-risk, drop the approval step entirely, not everything needs a gate, and every gate you remove is time back.
Resource Utilization Rate
Resource utilization rate measures how effectively your team’s time and skills are being used across campaigns and projects. It helps you understand whether work is distributed evenly or if certain team members are overloaded while others have available capacity.
The instinct is to push this number toward 100%, and that instinct is a mistake. A team running flat out has no room to absorb a rush request, a sick day, or a client escalation. So, the moment anything unexpected lands (and something always does), there’s nowhere to put it, and it turns into a fire drill that pushes other work late.
Picture a five-person team booked at 95%. On paper, peak productivity. Then one person catches the flu the same week a client demands an urgent campaign. There’s no absorptive capacity anywhere, so three unrelated deadlines slip at once only because the system was engineered with no margin.
The goal isn’t maximum utilization, it’s sustainable utilization. Like any good operations KPI, resource utilization should help you build a resilient team, not one that’s constantly operating at its limit.
How to improve it: Review team workloads regularly, leave room for unplanned work, and rebalance projects before individuals become overloaded. A small amount of available capacity today is often what prevents major delays tomorrow.
Team Capacity
Team capacity measures how much work your team can realistically handle within a given period based on the people, skills, and time available. Unlike resource utilization, which looks at how busy your team is, capacity helps you understand how much additional work they can take on without affecting quality or deadlines. This KPI for marketing ops enables proactive planning instead of reactive firefighting. Gartner’s latest CMO survey shows that marketing leaders are being asked to achieve growth despite shrinking budgets, making realistic capacity planning essential for avoiding burnout and missed deadlines.
Without a clear view of capacity, it’s easy to overcommit. Teams often agree to new campaigns without realizing they’re already operating at full bandwidth, leading to rushed work, missed deadlines, and employee burnout.
Knowing your real capacity turns intake from a reflex into a decision. When a new client or a surprise launch land, you can see whether it actually fits, what it would displace if you said yes, or what you’d need to add to take it on without breaking the people already at the limit. That’s a fundamentally different conversation than “we’ll make it work”; it’s the difference between planning and hoping.
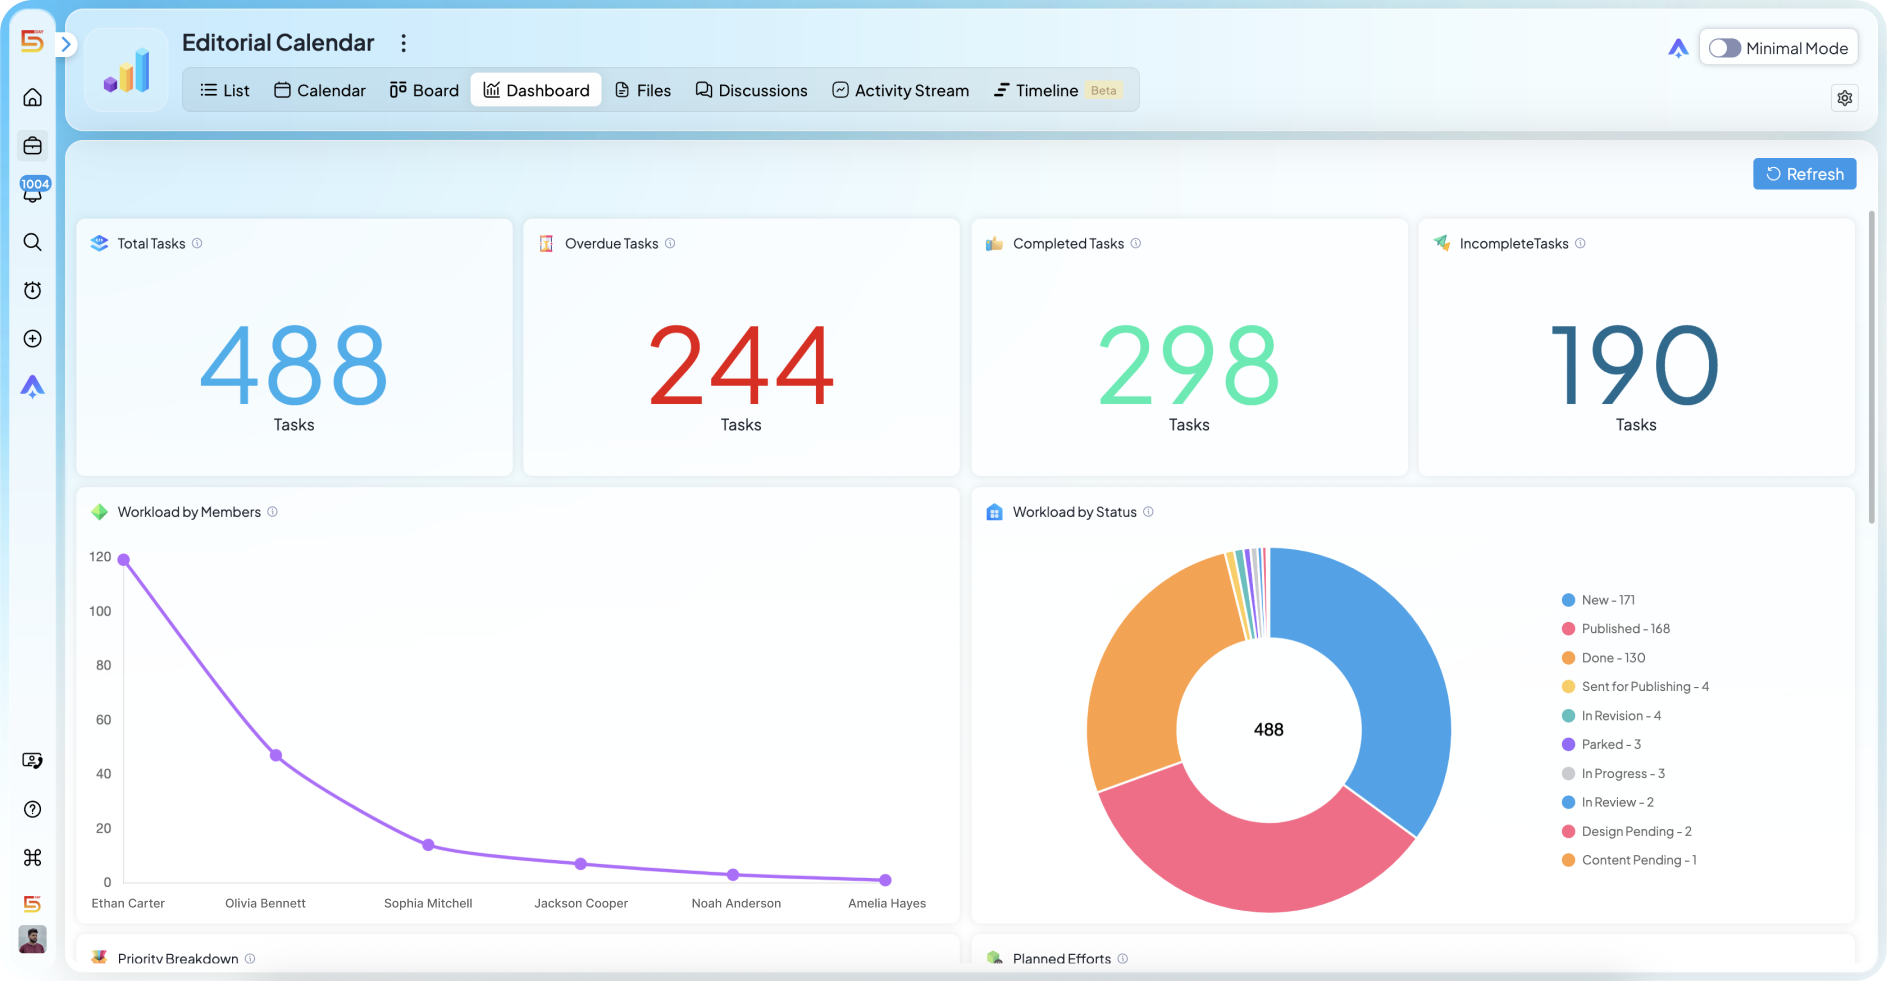
How to improve it: Establish a rough baseline on how much your team typically completes at a healthy pace and check new work against it before committing. When you’re consistently at the ceiling, treat it as a real signal to resource up or say no.
Work in progress (WIP)
Work in progress is simply how many things are open at once; campaigns, assets, tasks actively in motion across the team or a single person. While it may seem productive to have multiple initiatives running simultaneously, too much work in progress often has the opposite effect. As an operations KPI, WIP reveals whether your team is focusing on finishing work or simply starting more of it.
When team members constantly switch between projects, productivity drops, priorities become unclear, and campaigns take longer to complete. Instead of finishing work efficiently, teams end up making slower progress across everything.
Picture two writers. One is drafting six articles “in parallel,” nudging each forward a little every day. The other takes them one at a time and ships. The second writer finishes the first article in days while the first writer’s six all sit at 60% for weeks. Same effort but wildly different output, purely because of how much was open at once.
How to improve it: Cap how much work is allowed to be active at one time and hold the line when the cap is full, finish something before starting anything new. It feels counterintuitive to not start available work, but limiting WIP is often the single fastest way to pull cycle time down without adding a person.
Rework Rate
Rework rate is how often deliverables come back for significant revisions after they were supposedly done. This marketing operations KPIs highlights the most expensive waste in marketing for a blunt reason: you pay for the same work twice. Every extra revision cycle is time your team already spent, spent again and time that could have gone to the next campaign instead.
A round or two of edits is normal and healthy; that’s just collaboration. The signal is the pattern. When a team is routinely grinding through four and five revision cycles on fairly standard assets, the instinct is to blame the people producing the work. That’s almost always wrong. High rework rarely means bad producers, it means the target was undefined when they started. Either the brief was vague, or the person with real opinions showed up late, so the first draft was aiming at something nobody had specified.
Take a design team stuck in endless revision loops with one particular stakeholder who “knows it when they see it.” No amount of designer diligence solves that; the stakeholder’s taste only becomes concrete once there’s something to react to. The fix is forcing more of that reaction up front with references, must-haves, hard constraints in the brief so the first draft lands in the right neighborhood.
How to improve it: Track where rework clusters, not just how much there is. If it concentrates around one client, one channel, or one reviewer, you’ve found a specific briefing gap to close. Tighten those briefs, pull the decision-maker in before production starts, and the revision cycles fall on their own.
Task Completion Rate
Task completion rate is how much of the work your team planned for a period actually got finished within it. This KPI for marketing ops provides a clear view of whether your team is delivering the work they committed to and helps identify gaps between planning and execution.
Planning is what separates it from the KPIs around it. On-time delivery is about hitting dates. Throughput is about raw volume. Completion rate is about the gap between what you said you’d do and what you did and that gap is almost always a planning problem, not an effort one
One caution: don’t chase a perfect 100%. A team that finishes exactly what it planned every single time is probably sandbagging, planning so conservatively there’s no stretch left. Healthy sits a little below perfect, with the occasional miss you actually learn from.
Like any effective operations KPI, task completion rate is most valuable when it drives better decisions. If teams consistently finish less than they planned, it’s a signal to revisit workload planning, priorities, or capacity and not simply ask people to work harder.
How to improve it: Plan against real capacity rather than hope, and protect the plan once it’s set. Resist mid-sprint additions that guarantee something else slips. When completion is chronically low, cut the plan until the team can hit it, then build back up from a number people trust.
Cross-Team Handoff Time
Cross-team handoff time tracks how long work sits while it moves between functions – content to design, design to paid, marketing to sales. This marketing operation metric measures the gaps between teams rather than the work inside any one of them.
A writer finishes a blog post and marks it “ready for design.” But design doesn’t know it’s waiting, it’s not in their queue, no one told them, the handoff was a status change nobody saw. So it sits for two days until someone happens to notice, or the writer chases it. Multiply that across every content-to-design, design-to-paid, and marketing-to-sales pass in a campaign, and the handoffs alone can add up to more delay than all the actual production combined.
The trap is that handoffs are nearly invisible on standard dashboards. Each individual team’s metrics look healthy, and everyone’s hitting their own turnaround. You only see it when you measure the gap itself, the clock between “one team finished” and “the next team started.”
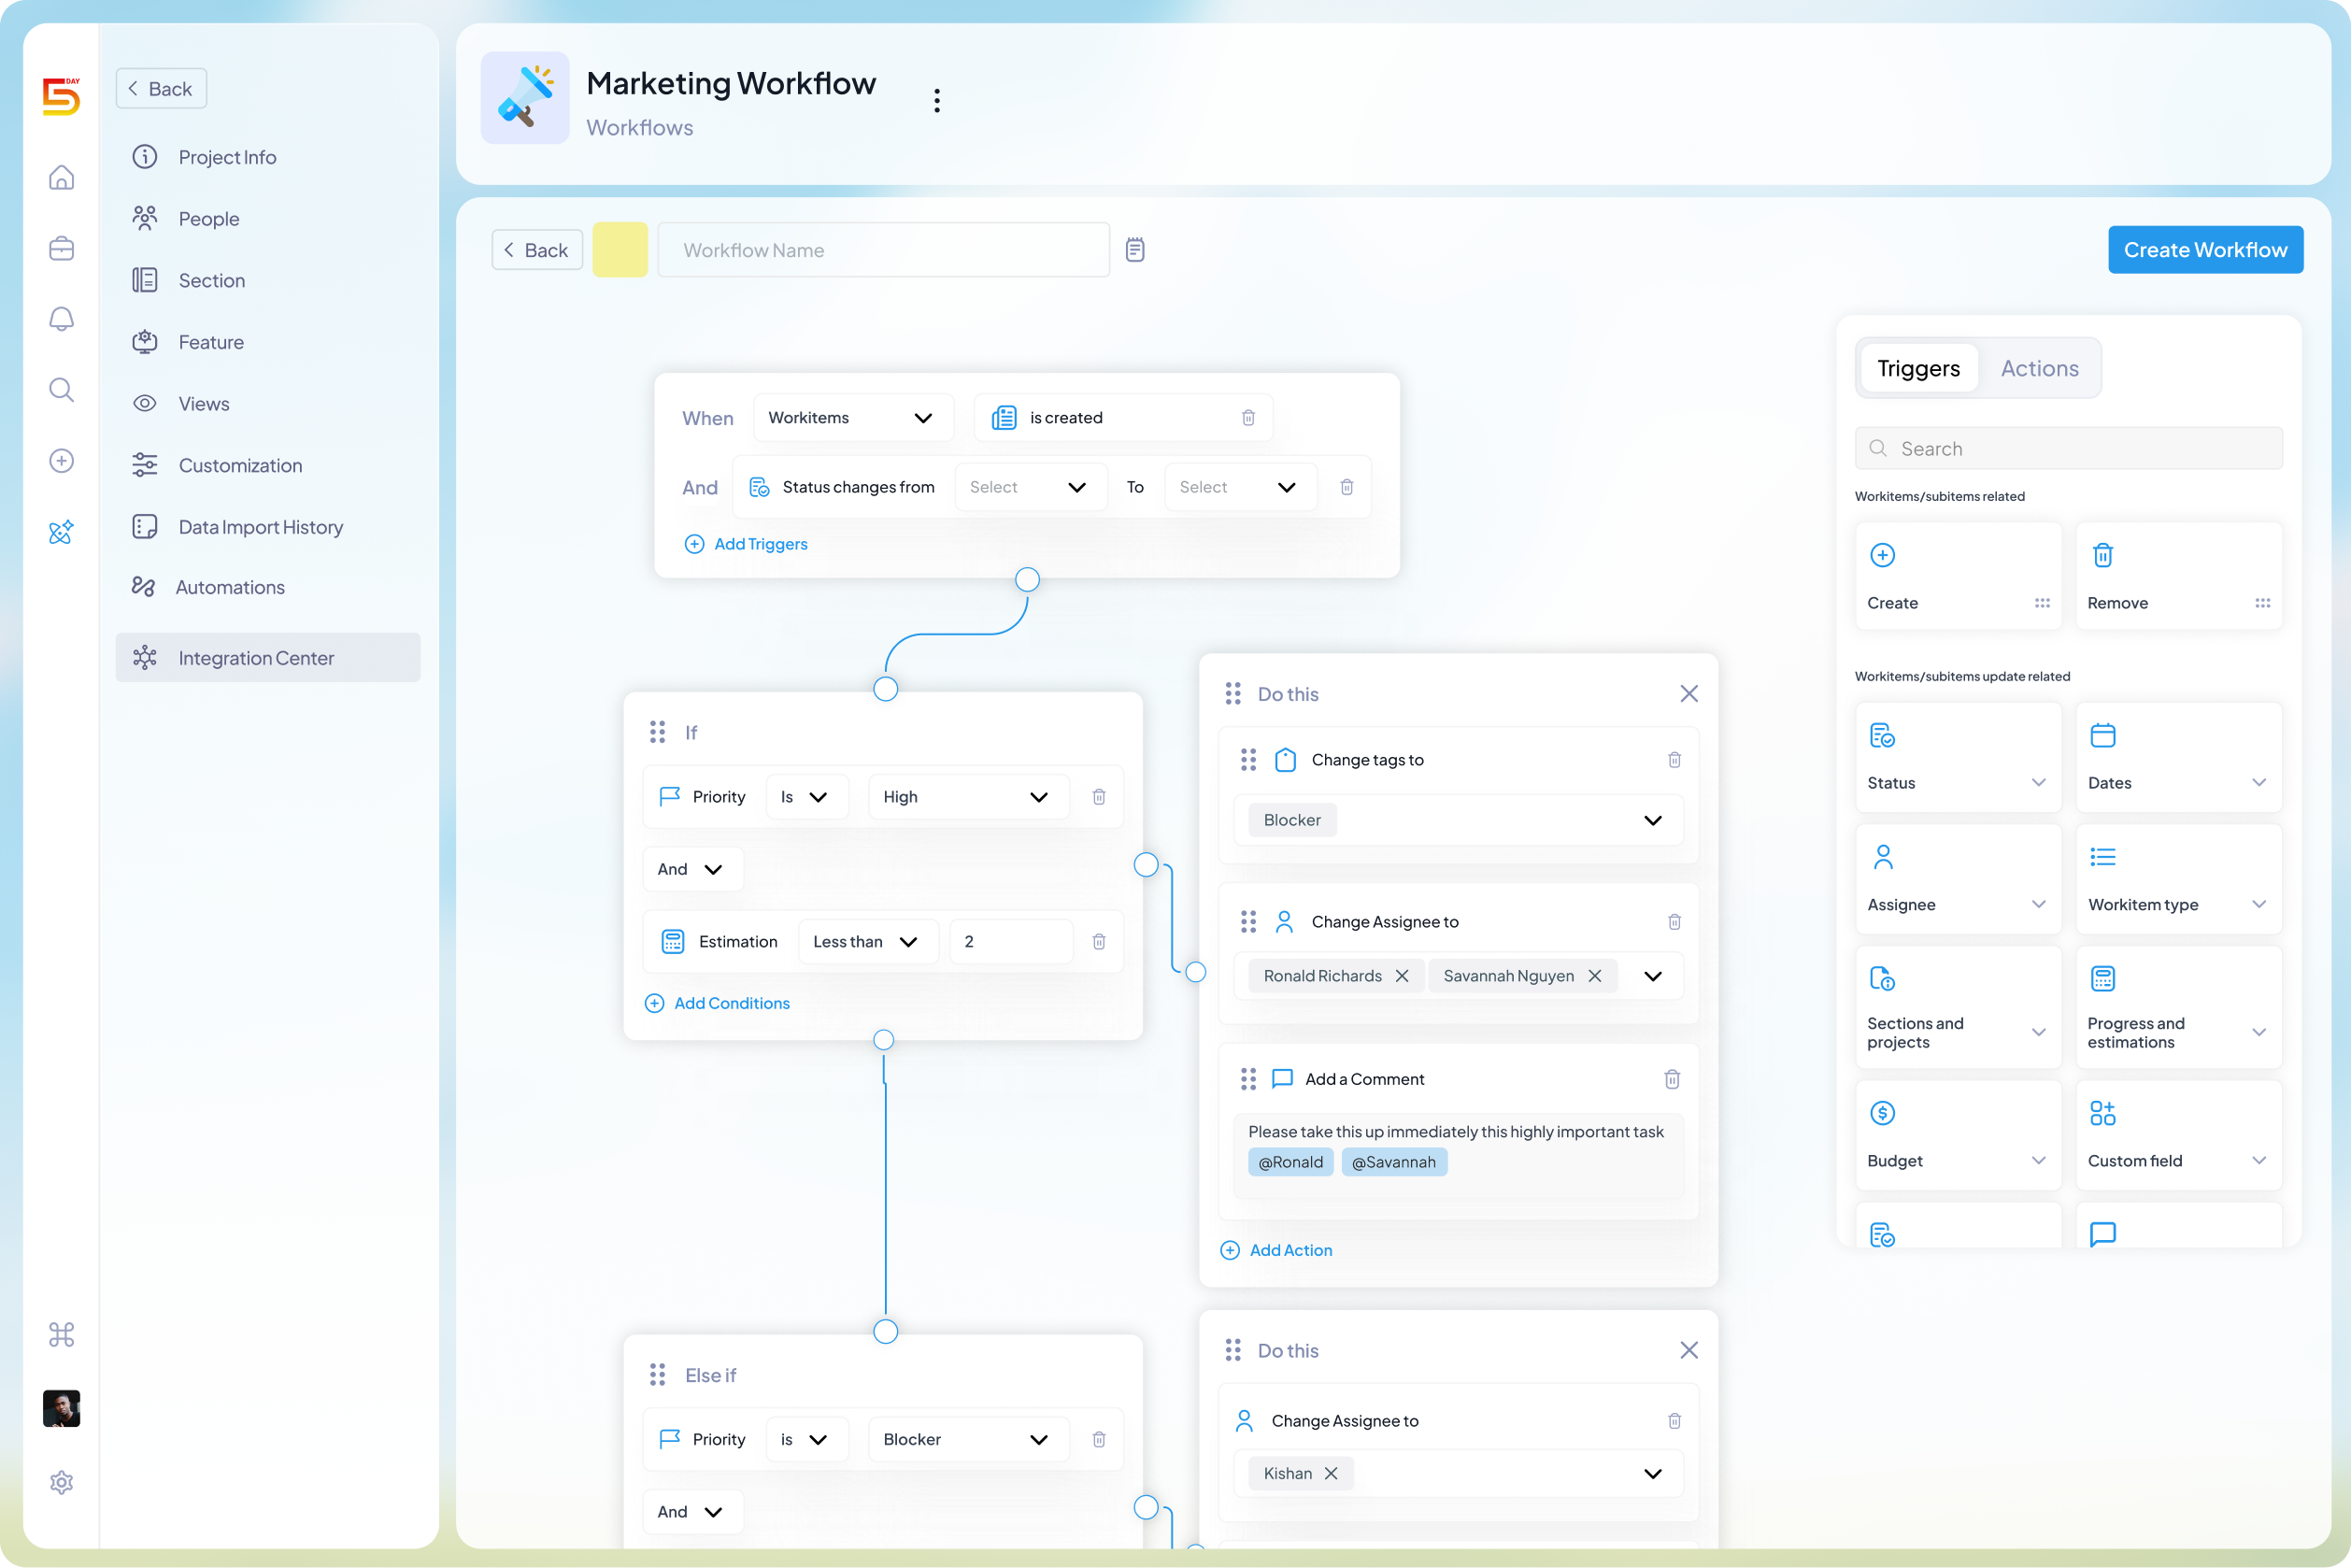
How to improve it: Make handoffs a trigger. The moment work is marked ready, the receiving team should get a real notification and a clear owner on their side, so the baton is actively handed over.
CampaignThroughput
Campaign throughput measures the number of campaigns your team successfully completes and launches within a given timeframe, such as a month or quarter. Unlike productivity metrics that focus on individual tasks, throughput looks at the bigger picture, how much meaningful work your marketing team is actually delivering.
A high campaign throughput doesn’t necessarily mean your team is working harder. Instead, it often indicates that your processes are efficient, resources are well managed, and workflows are running smoothly. On the other hand, a sudden drop in throughput may point to bottlenecks, capacity constraints, or inefficiencies that are slowing execution.
How to improve it: Don’t chase throughput directly. Raise it by removing the constraints the earlier KPIs surfaced: shorten cycle time, cut the waits at approvals and handoffs, drop rework. Fix the system and throughput rises as a result.
Common Marketing Operations KPI Mistakes
Tracking the right marketing operations KPIs is only half the battle. The real value comes from using those metrics to improve how your team plans, collaborates, and executes work. Here are some common mistakes marketing teams make, and how to avoid them.
- Tracking too many KPIs: When everything is a priority, nothing is. It’s tempting to measure every available metric, but overcrowded dashboards often create more confusion than clarity. Instead, focus on a small set of KPIs that align with your team’s goals and directly influence decision-making.
- Confusing activity with progress: Vanity metrics often create an illusion of success. More followers, impressions, emails sent, or campaigns launched may look impressive on a dashboard, but they don’t always translate into business impact. A team can publish content every day and still struggle to generate a pipeline. The most valuable KPIs measure outcomes and operational efficiency, not just how busy your team appears to be.
- Assigning KPIs without ownership: A KPI without an owner is just another number on a dashboard. Every metric should have someone responsible for monitoring it, improving it, and reporting on its progress. Equally important is setting a clear target. Without ownership and measurable goals, it’s impossible to know whether performance is improving or where action is needed.
- Setting KPIs and never revisiting them: Marketing evolves quickly. New channels emerge, business priorities shift, and team objectives change. The KPIs that mattered a year ago may no longer reflect what success looks like today. Review your marketing ops KPI regularly to ensure they continue to align with your business goals and operational priorities.
- Measuring outcomes, but ignoring execution: Many teams track leads, revenue, and ROI but overlook the operational metrics that influence those results. When campaign performance declines, they know what happened but not why. Pairing performance KPIs with marketing operations KPIs like campaign cycle time, approval turnaround time, and resource utilization gives you the context needed to identify issues before they impact results.
- Reporting KPIs without taking action: The biggest mistake isn’t tracking the wrong KPI—it’s tracking one that never influences a decision. If a metric is reviewed every month but never leads to a discussion, process improvement, or change in priorities, it’s simply reporting for the sake of reporting. Every KPI should answer a question and trigger an action when it moves in the wrong direction.
Marketing performance will always matter. But improving performance starts with improving how work gets done. Teams that consistently deliver successful campaigns don’t rely on better reporting alone, they build processes that help campaigns move from idea to launch with fewer delays, clearer ownership, and better visibility.
You don’t need to track every operational KPI from day one. Start with the bottleneck that’s slowing your team down today. If campaigns are launching late, measure cycle time. If reviews are causing delays, track approval turnaround. If workloads feel unmanageable, focus on capacity and resource utilization. As each process improves, expand your scorecard to include the next priority.
The right KPIs should help your team make better decisions, remove friction, and deliver work more consistently. When paired with the right marketing operations platform, those insights become easier to measure, monitor, and act on; turning operational visibility into a competitive advantage.
Want to see how these KPIs work in practice? Read How 5day.io’s Marketing Team Uses 5day.io for a behind-the-scenes look at how our team tracks campaign delivery, approvals, capacity, and workflows using the same operational principles covered in this guide.